Hamlet: Do you see yonder cloud that’s almost in the shape of a camel?
Polonius: By th’ mass, and ’tis like a camel indeed.
Hamlet: Methinks it is like a weasel.
Polonius: It is backed like a weasel.
Hamlet: Or like a whale?
Polonius: Very like a whale.
Act 3, Scene 2, Hamlet, by William Shakespeare
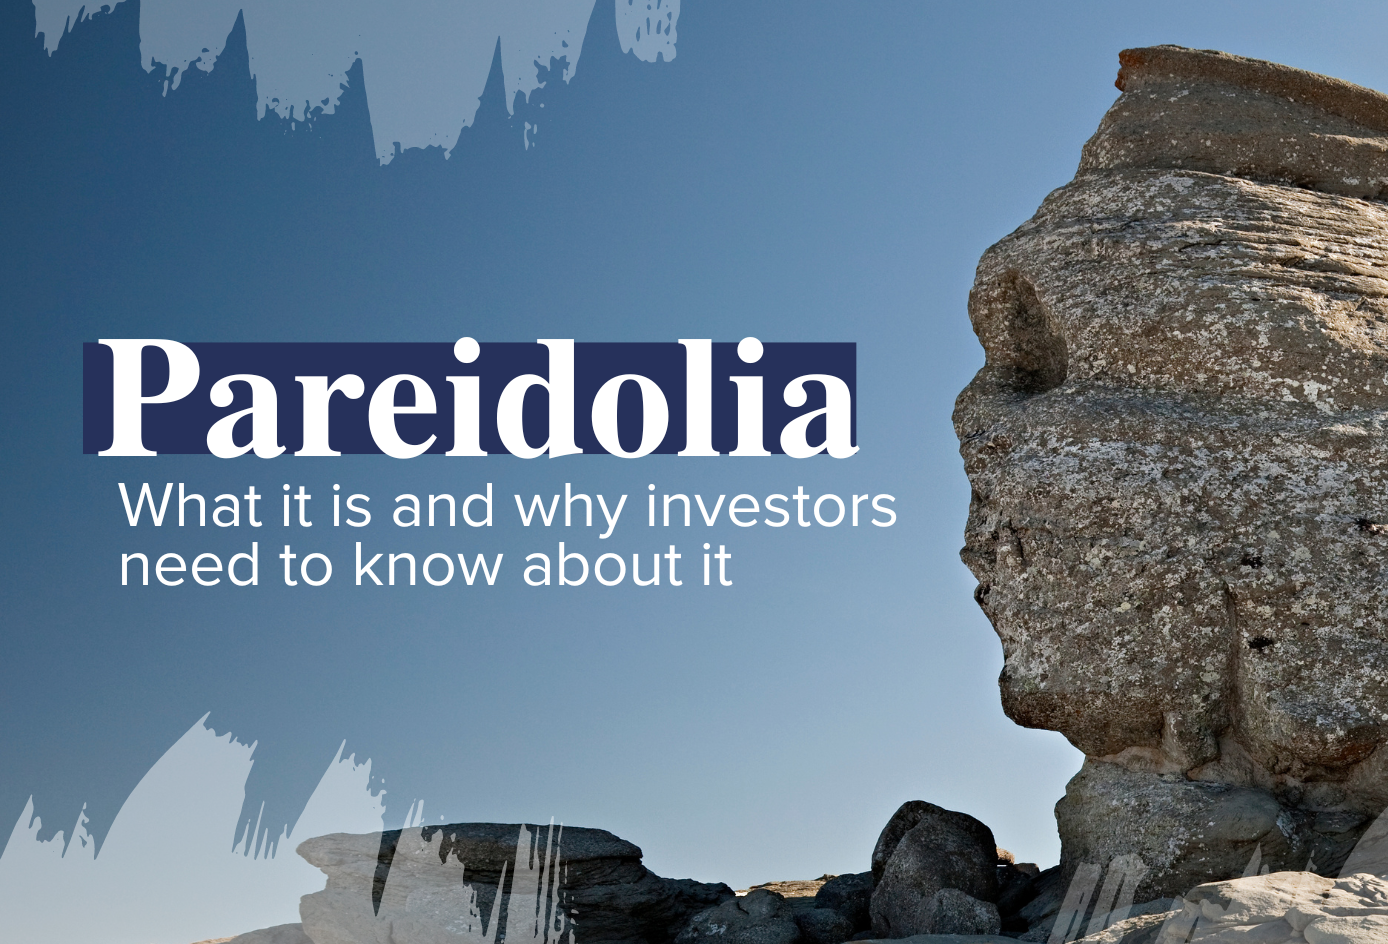
Perhaps you never believed in the man on the moon. But you may well have thought, at some stage, that you saw the shape of an animal in a cloud. Or perhaps it was a face you saw in a vegetable, a piece of fruit or a slice of toast?
All of these are examples of a psychological phenomenon called pareidolia. It refers to our tendency to perceive recognisable patterns in random or ambiguous visual stimuli.
The human brain is wired to recognise familiar objects and shapes, particularly faces. Even when there's only minimal information suggesting a face or form, people still see it clearly.
Pareidolia was once considered to be a symptom of psychosis. It’s now generally recognised as a common part of the human experience and indeed, as an evolutionary adaption that’s central to our ability to learn.
For our ancestors, pareidolia was vital for survival. It meant they could recognise friends and foes quickly. It also helped them to communicate, to hunt, and to develop tools and cognitive skills.
Pareidolia trips investors up
It may still be helpful in the modern world in some respects, but pareidolia can be very harmful in others, and Investing is a prime example.
The financial markets are extremely complex. So too are the various factors — economic, political, strategic and so on — that cause prices to rise and fall. The markets are also very uncertain. They respond to new information, and news, by definition, is very hard to predict.
Because they’re human, investors dislike complexity and uncertainty. Instead, they crave clarity and predictability. They want the comfort of knowing that either they have the skill and insight required to understand what’s going on and what’s likely to happen in the future, or that they can at least identify somebody else who does.
So they look for patterns, and, even where patterns don’t exist, they convince themselves otherwise because it makes them feel better. "The curious paradox,” the Nobel Prize-winning behavioural finance expert Daniel Kahneman wrote, “is that when we find patterns, we impose our own order on the randomness of life, and often see what we want to see." (1)
Professional investors rely on charts
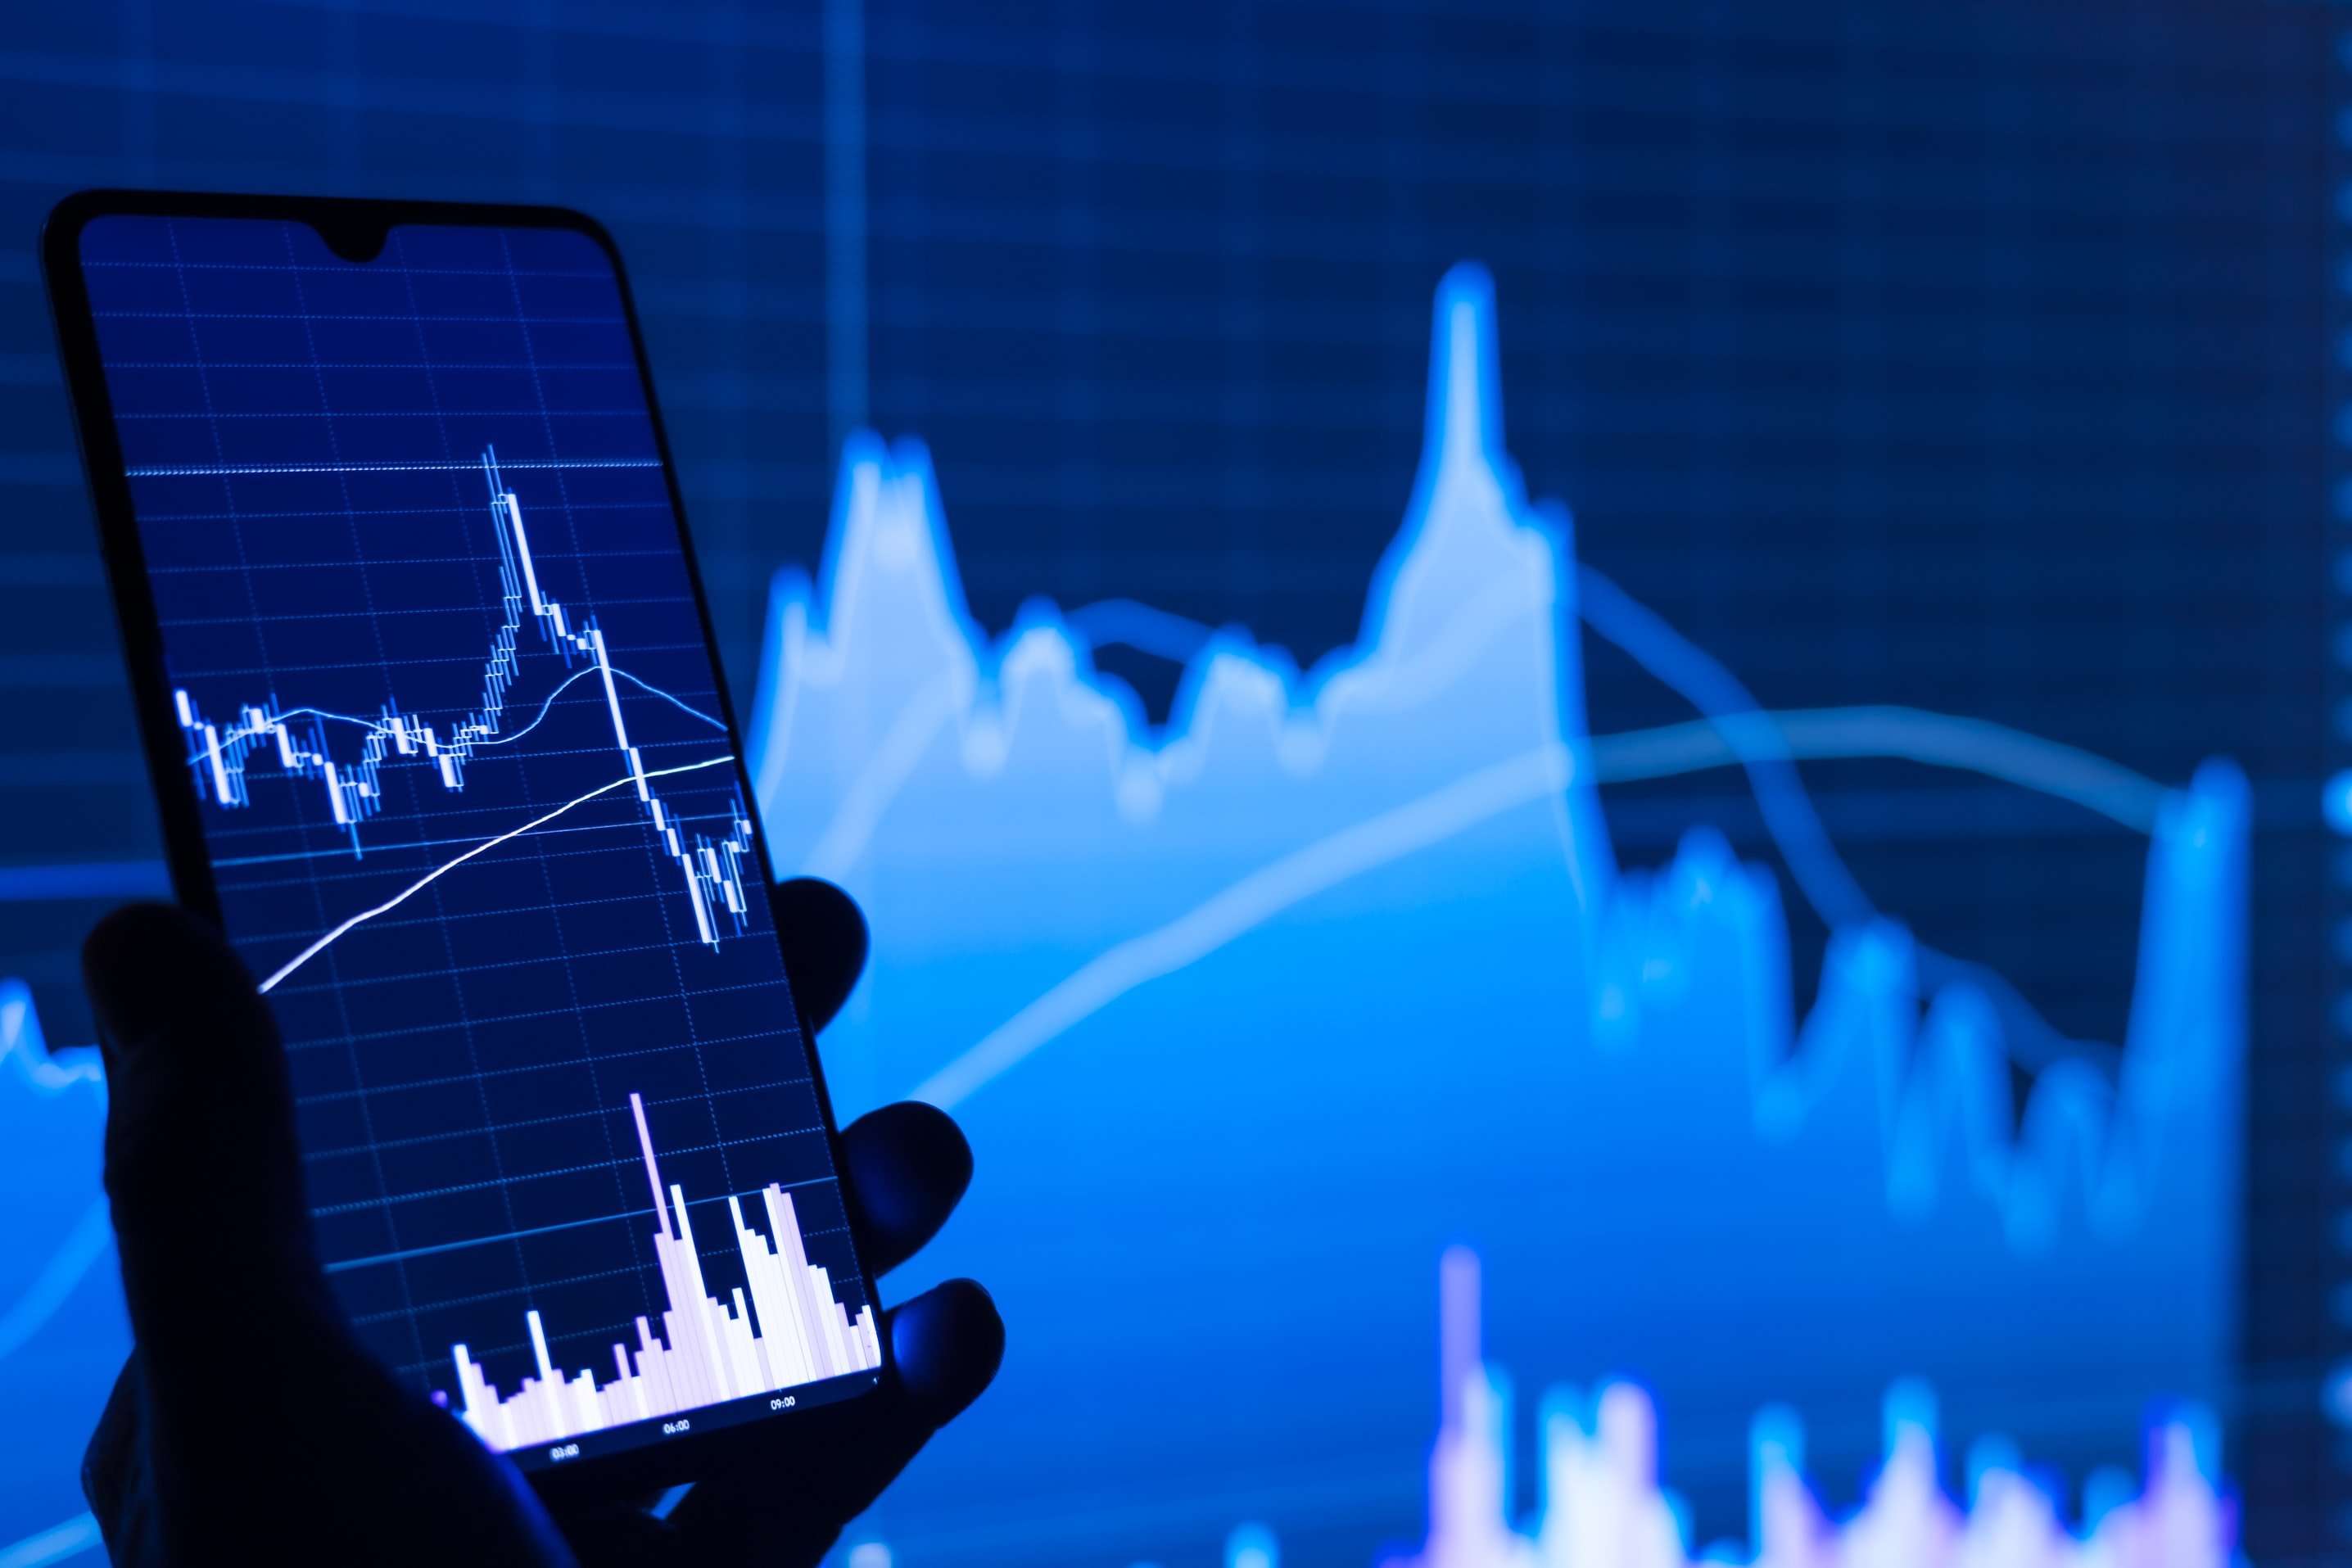
The most obvious example in investing is the tendency of many investors, especially professional ones, to rely on technical charts.
These are visual representations of historical market data (mainly prices or trading volumes) that are used by traders and investors to analyse trends, patterns and potential market behaviour, in order to make better decisions. They are a cornerstone of technical analysis, which posits that past trading activity and price changes can be valuable indicators of future price movements.
One well-known chart pattern is the “head and shoulders” pattern. (2) This pattern is generally seen as an indicator of a reversal in the prevailing trend. It appears as a baseline with three peaks; the middle peak (head) is the highest and the two outside peaks (shoulders) are lower and roughly equal in height. The "neckline" is drawn by connecting the lowest points of the two troughs. A head and shoulders pattern typically signals that an upward trend is nearing its end, especially if prices break below the neckline after forming the second shoulder.
Technical analysts also talk about “double tops” and “double bottoms”. A double top occurs after an uptrend and looks like two consecutive peaks that are almost equal, with a moderate trough in between. It suggests a potential reversal to a downtrend. Conversely, a double bottom, which appears after a downtrend, resembles the letter "W" and indicates a possible shift to an uptrend.
Why charts are misleading
However, basing investment decisions on a technical chart is not a wise move for several reasons. For a start, interpretations of patterns in markets can be highly subjective. Different traders might see different patterns in the same chart, leading to different trading decisions. Also, market conditions can change very quickly, and so too can market patterns.
Another danger is confirmation bias; in other words, traders might only notice patterns that confirm their existing beliefs about the market, potentially leading to biased or flawed decisions. Patterns can also generate false signals, suggesting a move that does not materialise, resulting in losses.
The biggest problem with the widespread use of technical charts, however, is that it defies basic academic finance. The evidence is overwhelming that stock prices are unpredictable. Markets are very competitive and broadly efficient, and so, at least in the short term, prices rise and fall in a random fashion. Yes, it’s possible to pick the right stocks at the right times or to invest in a fund manager who turns out to be a star performer, but that may just be down to random chance.
In his best-selling book, A Random Walk Down Wall Street, the Princeton economics professor Burton Malkiel describes how he once had his students create charts of fictional stocks by flipping a coin. (3) The stocks started at a price of $50. Each day, depending on a coin flip, the stocks either gained or lost fifty cents in value each day. The students soon realised that each stock’s ‘investment history’ looked entirely realistic.
“One of the charts showed a beautiful upward breakout from an inverted head and shoulders (a very bullish formation),” wrote Malkiel. “I showed it to a (professional) who practically jumped out of his skin. ‘What is this company?’ he exclaimed. "We've got to buy it immediately. This pattern’s a classic. There’s no question the stock will be up 15 points next week.’”
Three ways to combat pareidolia
So what’s the answer for investors? How can we prevent pareidolia having a negative impact on our investment returns?
The first thing is to recognise it. We’re all prone to pareidolia; it’s how our brains have evolved.
Secondly, consciously stop looking for patterns. Accept the randomness of market movements and that most financial data is nothing more than noise. What's happened in the past tells us little or nothing about what will happen in the future. Just because a stock or a fund has gone up or down for a while, don't assume that the trend will continue; you mustn’t assume either that it’s somehow “due” to fall or rise.
Finally, diversify your sources of information. If you feel minded to take a particular course of action, seek out information that challenges and contradicts that view. Remember, you might think a cloud looks like one particular animal, but I might think it resembles a different one entirely!
Of course, there is always a possibility that a chart you see really is
telling us something useful, or there truly is the smiling face of an Eastern mystic on your morning round of toast. But the odds are heavily stacked against it.
This article is produced by us for Financial Advisers who may choose to share it with their clients. Timeline Planning and Timeline Portfolios do not offer direct-to-consumer products.
Robin Powell is a journalist, author and editor of The Evidence-Based Investor.