
Summary
-
The plan: John (57) and Patricia (56) plan to retire at 65 with a total portfolio of £438,426.
-
What the chart shows: for every historical scenario, the highest level yearly spending the plan could have supported, after tax.
-
Worst case: in the weakest historical period, the portfolio supports about £67,000 a year.
-
Best case: in the strongest period, it supports about £134,000 a year.
-
The typical range: most scenarios starting between the 1930s and the early 1970s support roughly £70,000 to £80,000 a year.
Description
1. The plan
The plan includes spending life phases, one-off expenses, income sources and a total balance of £438,426.
The couple's planned spending life phases:
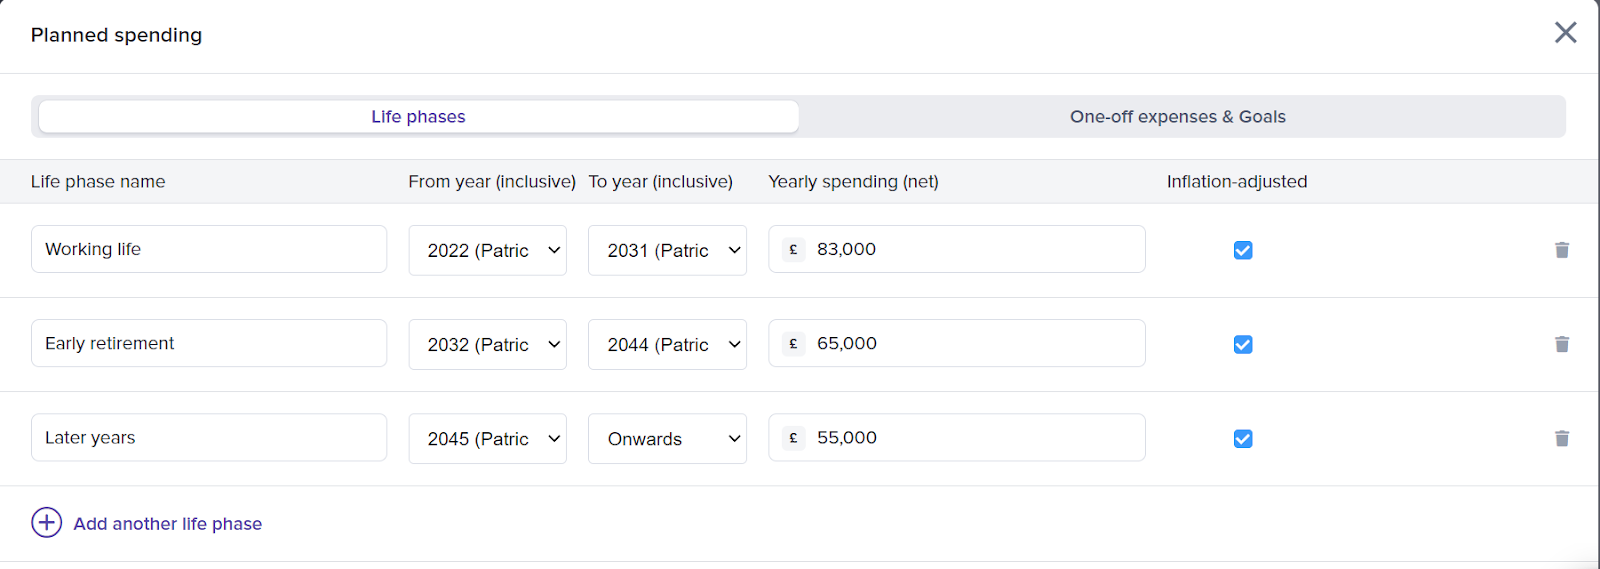
Their one-off expenses:
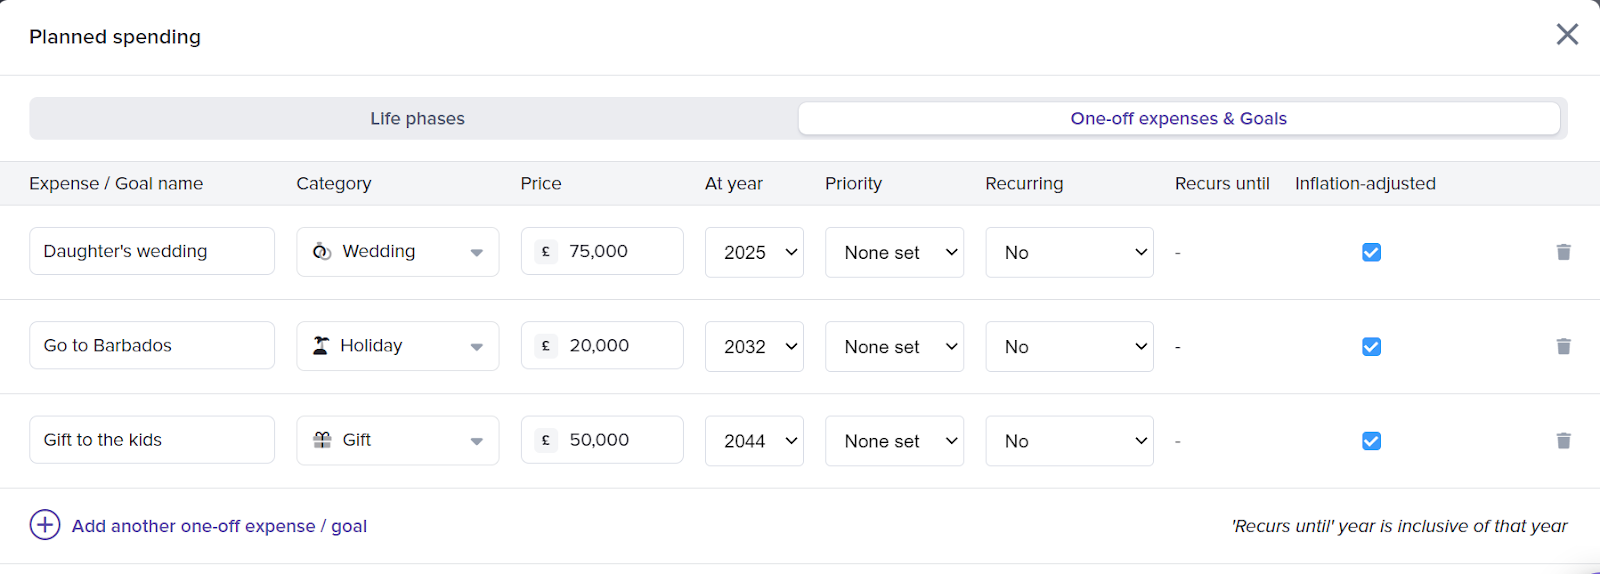
Their income sources:
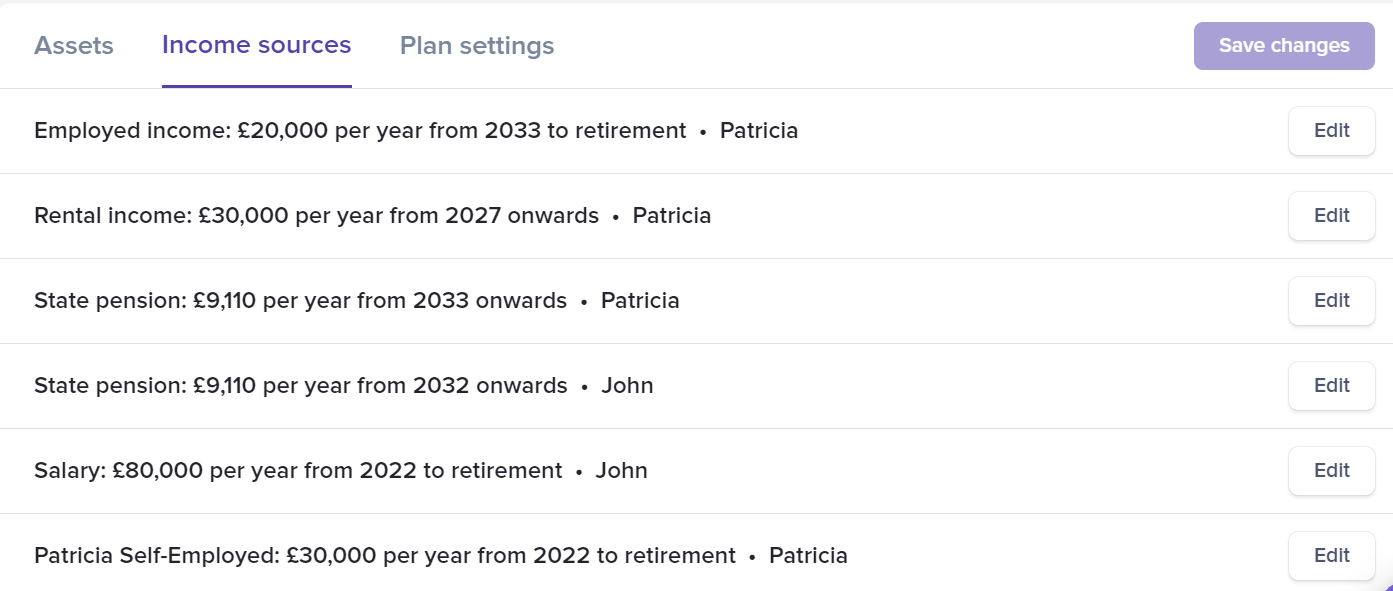
Their total portfolio allocation:

2. Reading the sustainable spending chart
Each bar is one historical scenario, placed by the date it starts. Its height is the highest level yearly spending the plan could have supported from age 56 onwards without running out. The chart replaces the plan's planned spending with a single level amount, and keeps everything else: income, accounts, contributions, tax and fees.
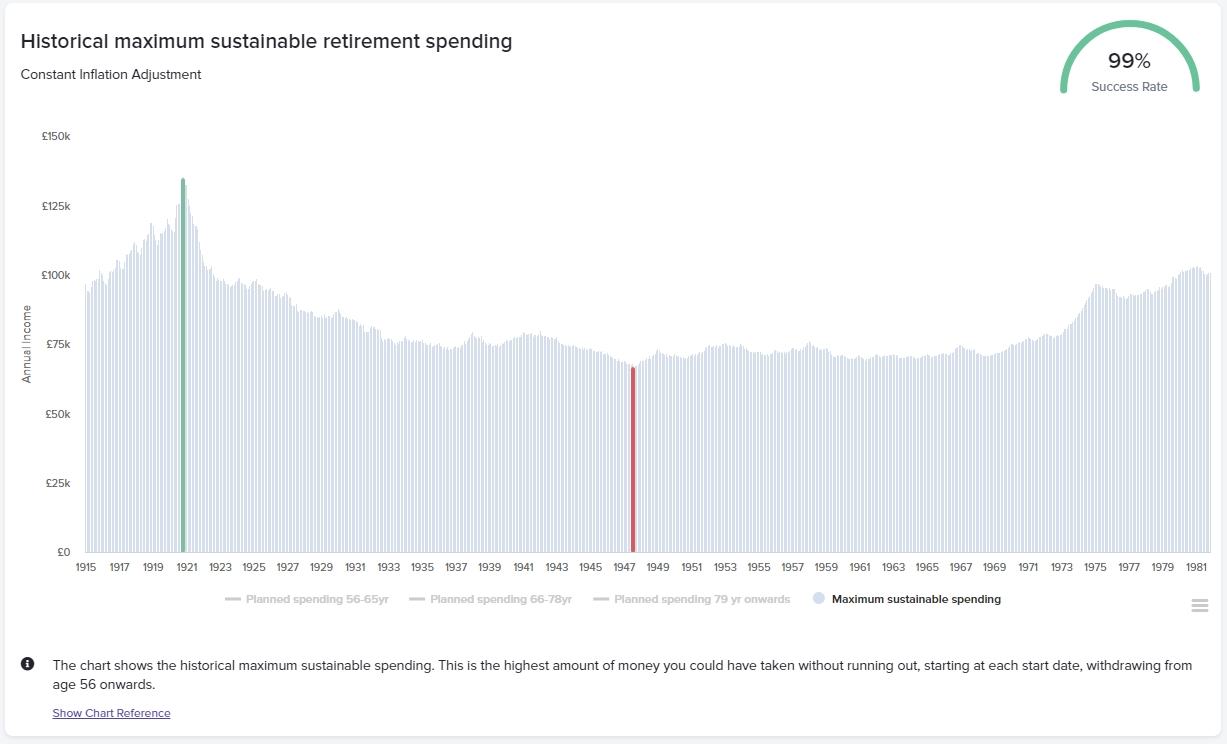
A single historical scenario (for example October 1936 to October 1976) may suggest a sustainable spending level of £74,500 a year after tax. Relying on one scenario is risky, because nobody knows which kind of period lies ahead. Across all the scenarios:
-
Worst case (red bar): the portfolio supports about £67,000 a year.
-
Best case (green bar): it supports up to about £134,000 a year.
-
Most scenarios: those starting between the 1930s and the early 1970s support roughly £70,000 to £80,000 a year.
This gives John and Patricia a realistic starting point, and shows how wide the range of outcomes is.
Example
Using the chart, John and Patricia could:
-
set an initial spending target close to the level most scenarios support, with the worst case of about £67,000 a year as a reference point;
-
spend more in the first years of retirement, when travel and activities are likely to cost more, and scale back later, leaving a buffer for poor markets or unexpected costs.
You can then model those life phases in the plan and check the success rate.
Conclusion
The sustainable spending chart turns "how much can we spend?" into a range grounded in real market history. John and Patricia can see the worst case, the best case and where most periods land, and choose a spending level that balances enjoying retirement now with keeping enough in reserve.
For how the chart works in general, read Explaining the sustainable spending chart.