
Summary
- Customisable Dashboards: Build and save unlimited workspace templates tailored to your specific analysis style.
- Expanded Comparison: Compare up to six portfolios simultaneously—doubling our previous limit.
- Advanced Benchmarking: Access Morningstar indices, inflation-linked benchmarks, and multi-asset funds via ISIN.
- Responsive Reporting: Generate PDF exports that automatically mirror your custom on-screen layout.
Introduction
We have moved away from rigid legacy systems to give you more control over your data. The upgraded analytics suite allows you to move beyond the standard "Technical" or "Client Friendly" views. Now, you can create an unlimited number of custom templates tailored to your specific needs—whether that is a deep-dive investment committee review or a simplified quarterly check-in for a client.
Description
The new experience is built around three core pillars: customisation, advanced comparison, and transparent reporting.
1. Building Custom Dashboards
You can now design your own workspace using the Template Manager:
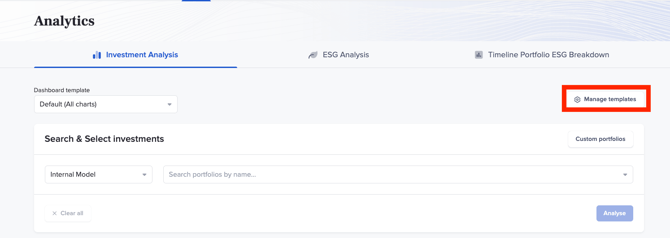
- Create: Navigate to Analytics and select Manage templates to start a new design.
- Customise: Choose exactly which charts you want to see (e.g., Performance, Top 10 Holdings, or Portfolio Costs) using simple toggle switches.

- Organise: Use the drag-and-drop feature to reorder charts so the most important information is always at the top.
2. Enhanced Comparison Tools
We have expanded our data capabilities to provide a more complete picture of investment health:
- Compare More: You can now compare up to six portfolios at once.
- Flexible Benchmarks: Measure performance against Morningstar Indices, Inflation benchmarks, or search for specific Multi-Asset Funds via ISIN.
- Specific Timeframes: Use the date selector to isolate relevant holding periods
3. Customised Reporting
To ensure your analysis reflects the real-world experience of your clients, you can now include:
- Custom Fees: Add specific Adviser and Platform costs via the Settings > Real Return Customisation menu to show net performance.
- Responsive Exports: The PDF Export tool is now "responsive." This means the layout of your downloaded report will automatically match the custom dashboard you built on your screen.