
Summary
- Timeline Planning uses long-term historical asset class data rather than individual fund data
- Asset classes enable stress testing against 100+ years of real market conditions
- Fund data lacks sufficient history for consistent long-term scenario modelling
- Each holding in a portfolio is mapped to one or more asset classes
- Plans are tested against real market history, including inflation, crashes and recoveries
Description
Timeline Planning takes an evidence-based approach to financial modelling by relying on asset class data instead of individual fund performance. This design choice is intentional: plans often run for 30 years or more, and the data behind them needs to cover periods at least that long.
Fund-level data, while useful for short-term tracking and reporting, typically only spans a few decades. This creates a structural limitation when modelling financial plans that often extend 30, 40, or even 50+ years into the future.
In contrast, Timeline’s asset class dataset extends back to January 1915, enabling simulations based on more than a century of real-world market behaviour. This allows advisers to test plans against a wide range of economic environments, including:
- Periods of high inflation
- Prolonged recessions
- Major market crashes
- Recovery cycles
This depth provides a much stronger foundation for understanding sequence of returns risk and long-term sustainability.
Capturing Market Events Across 100+ Years
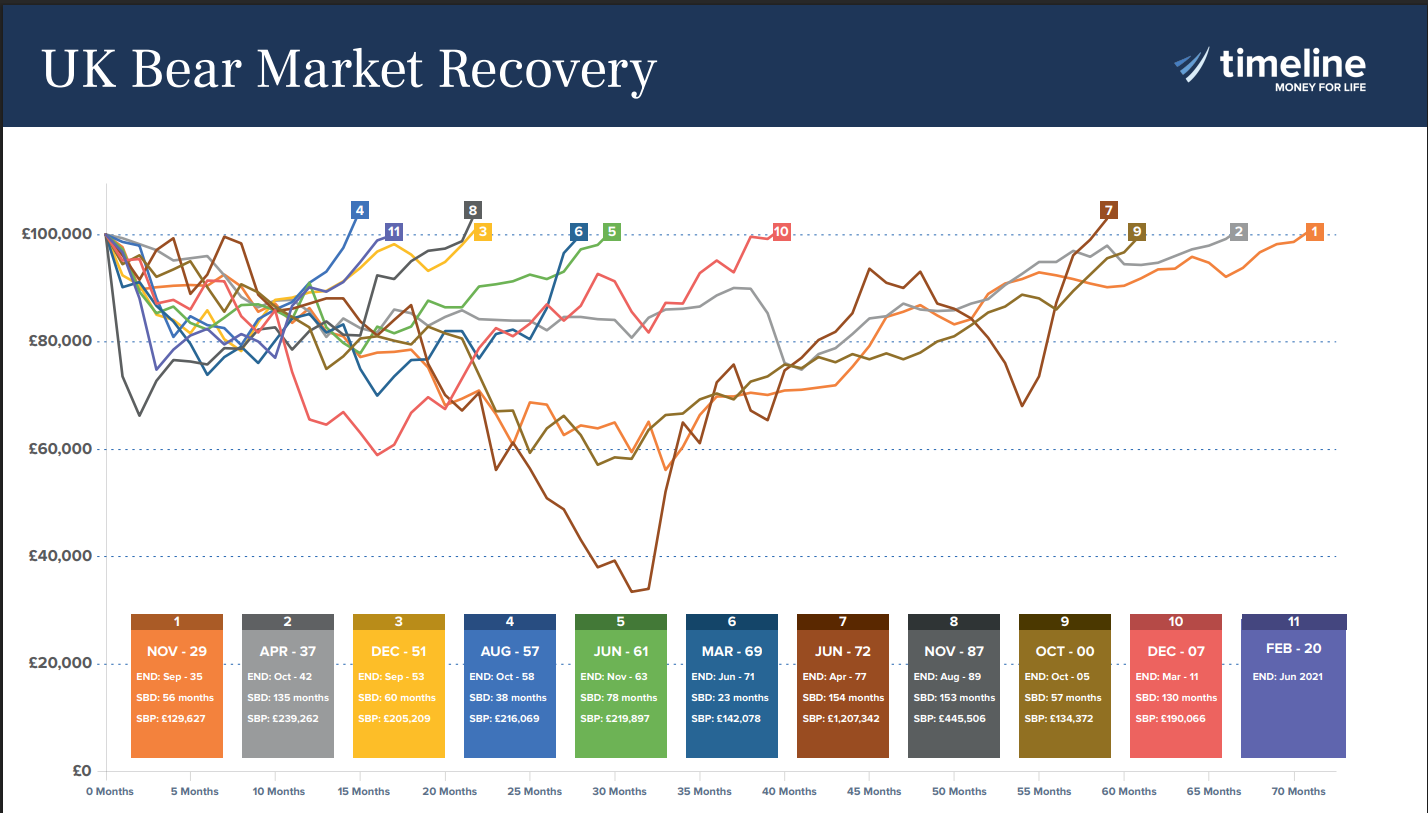
By using asset class data, Timeline can model how portfolios would have behaved during major historical events such as:
- The Great Depression
- The 1970s inflation crisis
- The 2008 financial crisis
- The COVID-19 market crash
This is not possible with most fund data, as many funds simply did not exist during earlier periods. As a result, relying solely on fund performance introduces recency bias and limits the ability to stress test plans under extreme but plausible conditions.
Mapping Portfolios to Asset Classes
To bridge the gap between real-world portfolios and historical data, Timeline maps each holding to one or more historical asset-class indices, such as UK equities, global equities, UK bonds, global bonds, property and cash.
The process works as follows:
- You choose a model portfolio for an account in the plan, or import the client's investment account.
- Timeline maps each holding to its asset classes.
- The combined asset allocation is then used to simulate outcomes using historical return data.
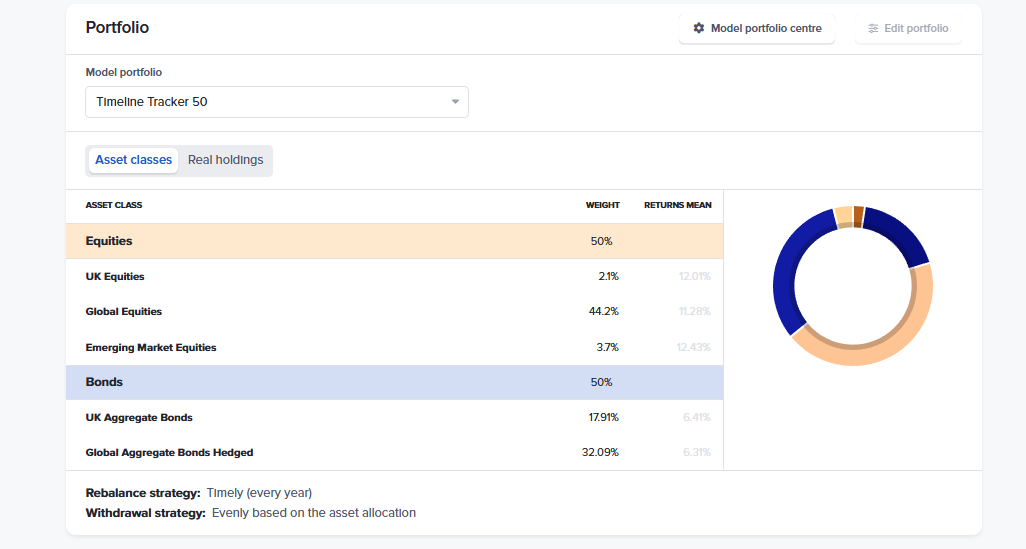
The account's "Portfolio" box shows the result under "Asset classes", with the underlying funds under "Real holdings". Getting the mapping right matters: a fund mapped to the wrong asset class changes the whole plan, so it's worth checking the asset-class split before you present a plan.
For example, a balanced portfolio with a 50/50 split between equities and bonds will be mapped to the relevant global equity and bond asset classes. This allows Timeline to simulate how that allocation would have performed across different historical periods.
Example
Consider a client portfolio made up of several modern funds with only 10 to 15 years of performance history.
If fund data were used:
- The model would only reflect recent market conditions
- Key stress periods like the Great Depression would be excluded
- Long-term risk could be underestimated
Using Timeline’s approach:
- The same portfolio is mapped to asset classes
- It is then tested across rolling historical periods since 1915
- The adviser can see how the plan performs under both favourable and adverse conditions
This provides a far more realistic view of potential outcomes and risks.
Conclusion
Timeline Planning’s use of asset class data over fund-level data is a deliberate product decision that prioritises long-term evidence over recent history.
By combining over 100 years of historical data with automatic mapping of each holding to asset classes, Timeline Planning lets you stress test a client's plan through periods their funds never lived through.