
Summary
-
What it does: Puts the client's current portfolio next to an alternative, with the costs of each, so the client can see what would change.
-
Plans too: Compare up to three financial plans in the same report, for example retiring at 65 against retiring at 67.
-
Where: In the Investment Account Analysis and Plans steps when you create a report.
Description
Clients ask two questions before agreeing to a change: what's different, and what does it cost? A comparison answers both with the client's own accounts and figures, so you don't have to build a side-by-side table in a spreadsheet.
1. Compare portfolios and their costs
Use a template that includes Investment Analysis sections, such as the default Switch Report template.
-
Create the report as usual (see Create and send a client report: a step-by-step guide). At the Investment Account Analysis step, answer yes to "Would you like to compare portfolios?".
-
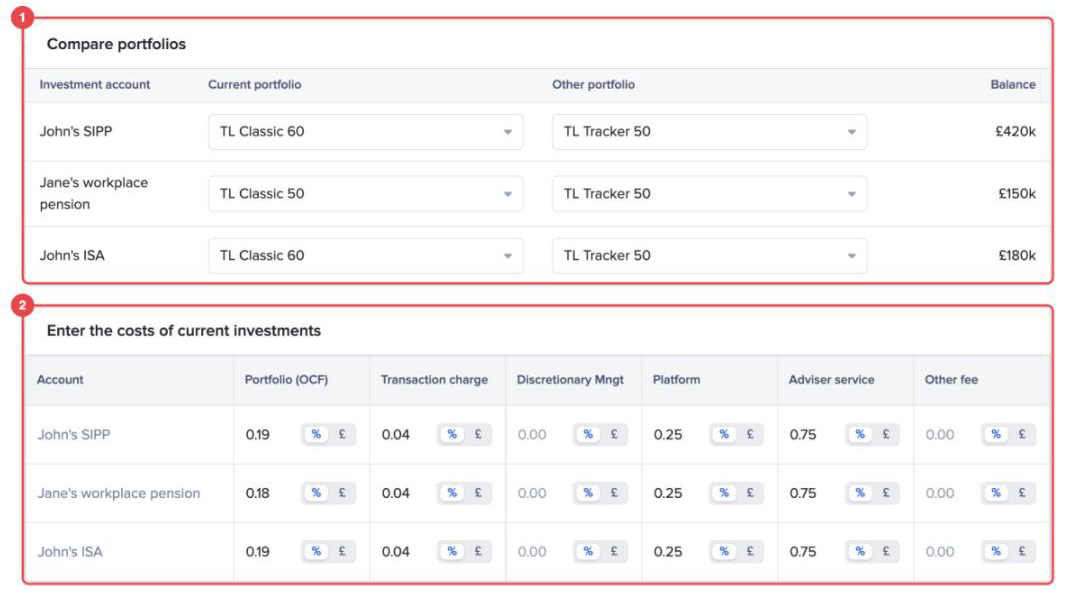
In the "Compare portfolios" table, each of the client's accounts is listed with its balance. Choose the "Current portfolio" and the "Other portfolio" you want to show for each account.
-
Under "Enter the costs of current investments", fill in the costs for each account: "Portfolio (OCF)", "Transaction charge", "Discretionary Mngt", "Platform", "Adviser service" and "Other fee". Use the % or £ switch next to each figure to choose how it's entered.
-
Fill in "Enter the costs of other Portfolios investments" in the same way, then choose the timeframe for the performance chart.
The report then shows both portfolios side by side in the sections you included, such as costs and charges, asset allocation and performance. Past performance is not a guide to future returns.
2. Compare financial plans
This needs at least two financial plans for the client, for example their current plan and one with a different retirement age or spending level.
-
At the Plans step, choose the main plan in "Financial plan to export".
-
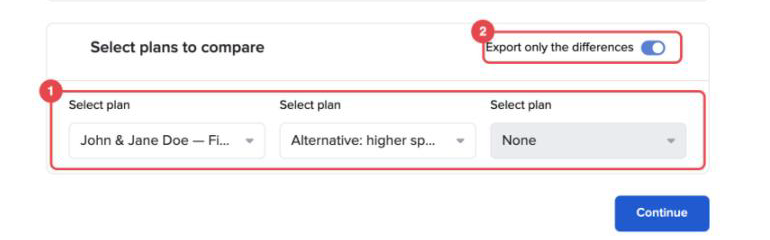
Under "Select plans to compare", choose up to three plans.
-
Switch on "Export only the differences" if you want the comparison to show only the figures that change between plans. This keeps the report shorter and makes the trade-off easier for the client to see.
If the client has only one plan, Timeline skips the comparison.
Example
Jane Doe holds her workplace pension in a portfolio with an ongoing charge of 0.18%, plus platform and adviser fees. Her adviser compares it with an alternative portfolio, enters both sets of costs and adds a second plan showing Jane retiring two years later. The report shows Jane both the cost difference and what the later retirement date means for her sustainable spending,.
Conclusion
Comparisons turn a recommendation into something the client can check for themselves. Because the figures come from their own accounts and plans, the conversation moves from "trust me" to "here's what changes".