Timeline Charts 2025 offers financial advisers an invaluable resource—a suite of data‑driven visuals that track the performance of inflation, cash, bonds, property, gold, equities and diversified portfolios from 1926 to today. In uncertain markets, these charts help advisers demonstrate long‑term trends and guide client decisions with clarity and confidence
Key Features of Timeline Charts 2025
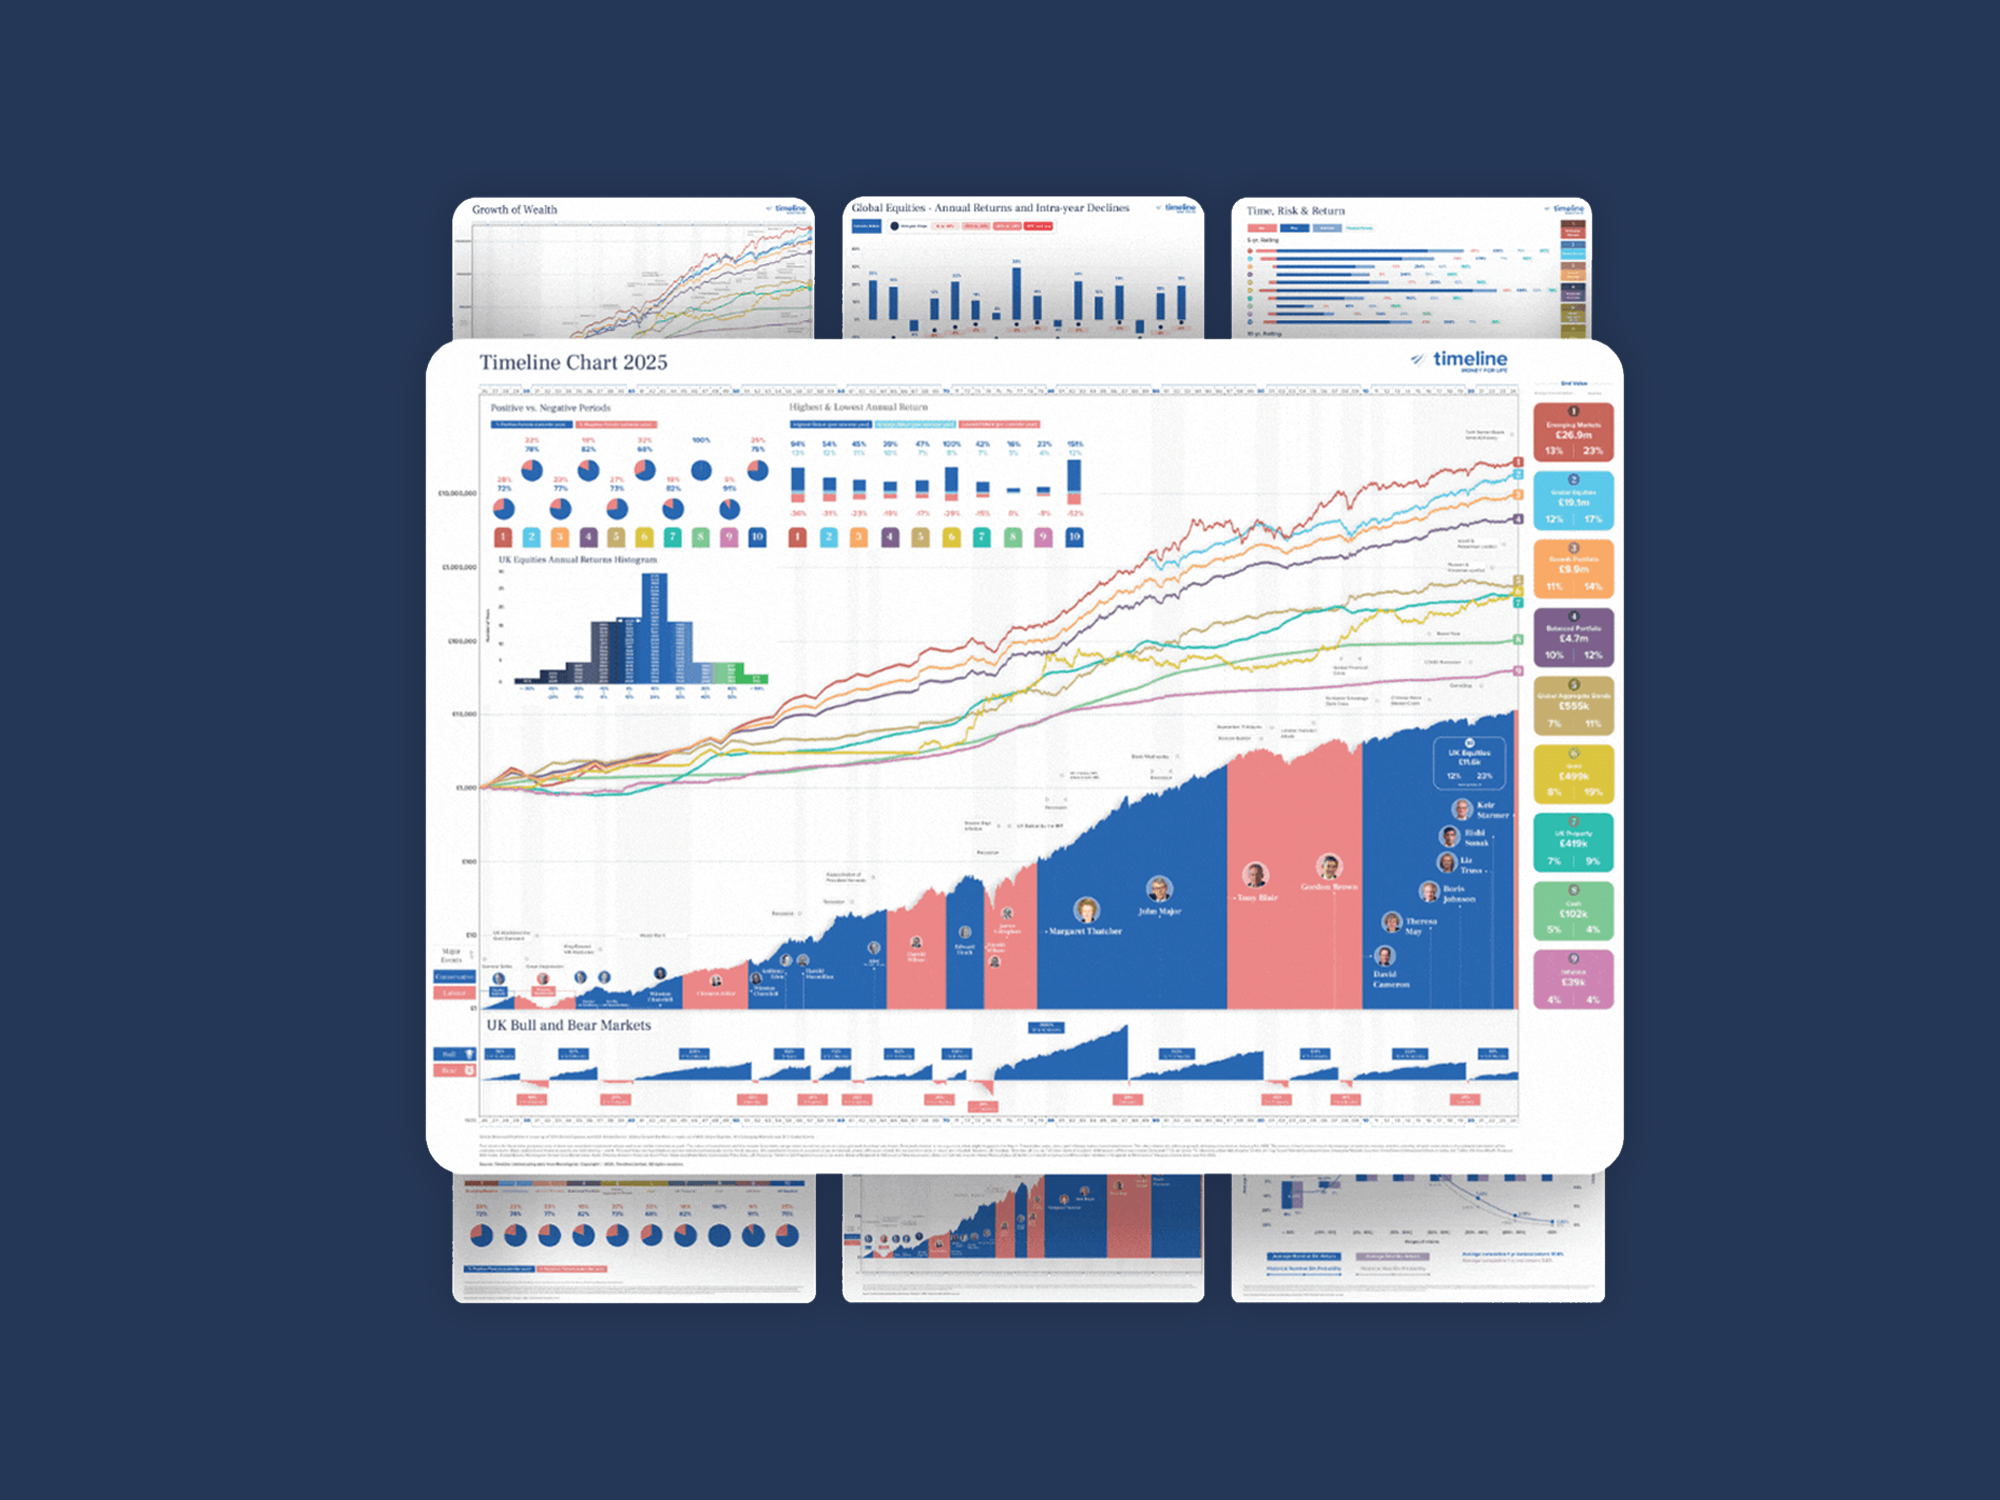
1. Rich Asset Class Coverage
The charts span nearly a century of capital markets, providing context across bull and bear markets, recessions and political cycles. This depth allows advisers to show how different asset classes and portfolios compound wealth over time.
2. Rich Asset Class Coverage
Advisers can present how diverse assets—such as inflation, cash, bonds, property, gold and equities—have performed across various market conditions, enhancing educational value and helping clients visualise long‑term outcomes.
3. Articulating Adviser Value During Market Stress
The charts are particularly powerful in bear markets. As market volatility grows, advisers can use them to emphasise the importance of long‑term perspective, reassure clients and help prevent impulsive decisions.
4. Seamless Integration with Timeline Planning Tools
These charts dovetail with the broader Timeline Planning ecosystem—allowing advisers to stress‑test client plans using over 100 years of data, align risk appetite with evidence‑based portfolios, and animate plans visually via the Control Centre.
Why These Charts Matter for UK Advisers
-
Build Client Confidence
Clear visual trends help clients understand that downturns are part of a bigger story—not anomalies—and reinforce the value of disciplined, long‑term financial planning. -
Elevate Client Conversations
During uncertain times, advisers can pivot from short‑term fear to long‑term resilience by illustrating how different assets historically respond in various environments. -
Reinforce Advice Through Evidence
Advisers can anchor advice in rigorous historical data, differentiating themselves through expertise and trusted, evidence‑backed planning. -
Enhance Cyber‑Secure Planning Workflows
When paired with Timeline’s planning tools, advisers can bring charts to life within audit‑ready, consumer‑duty‑aligned financial plans—streamlining workflow and strengthening compliance.
Download Timeline Charts 2025
To support your client conversations and evidence your advice with historical context, you can access the full set of charts today. The visuals are completely free to download and designed for professional use.

Use them in presentations, client reviews, or simply to reinforce the value of staying invested over time. This is one more way Timeline helps financial advisers deliver clear, credible, and compelling advice.