





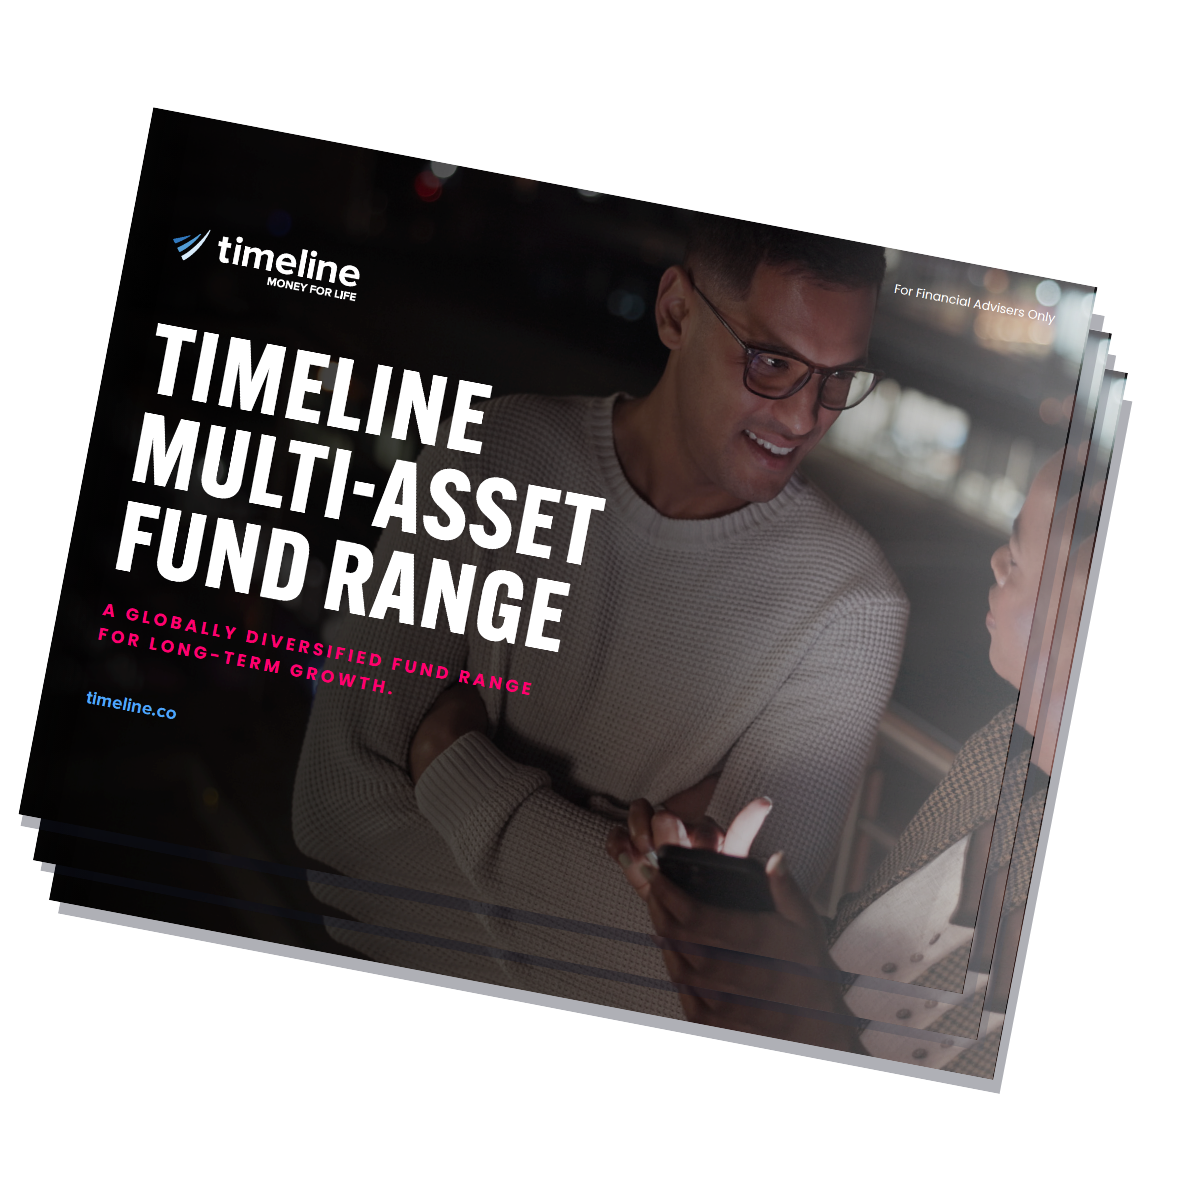













Good morning, everybody. I believe most of the people on the call I've met in the past. But just by way of introduction, am Laurentius Vanden Vorm. I'm the head of investment strategist here at Timeline. Let me just quickly bring up my screen, and I'll give a brief introduction of what we are going to talk about today. So the whole idea of today is to talk a bit about our multi asset funds that we've launched at TimeLine. Now we've done a couple of roadshows all across the country where we've been where we're focused on more smaller breakfast events just to talk a little bit about the funds that we initially are going to launch, then we talked about the funds that we have launched. And now we just thought now that we've got all the funds up and running, live performance data, live underlying allocation data, we thought it's a idea to do a webinar, open it up to all clients and just give you a bit more insight into the underlying funds. What I'll cover in today's session, mainly, I'll start off with just looking at the timeline funds itself, why we've decided to replicate our tracker strategy, not our classic strategy yet. And then also, I'll dive a little bit deeper into the font structure and the design. And then finally, we can do a q and a at the end. As Jake said, feel free to drop in any questions in the chat box. There's also a Jake, if you mentioned, there's a chat box and a Q and A center. I can only see the chat box on my screen. But Jake will keep track of all the questions as well, and we can cover them at the end or throughout this session. At the end, I will also quickly jump into the timeline app, just show you how the font looks like in the timeline app and then also how you can get a backtested version of the font should you should you require one. Right. So let's get started with the objective of the Timeline multi asset funds. And I think it's just important to note that the multi asset funds for Timeline was launched based on client demand. It's not a massive commercial incentive for TimeLine actually to for full disclosure. Revenue wise, the fund is slightly less profitable than our multi or our MPS product, but very much the same. So from TimeLine's point of view, we are very much indifferent whether you use our model portfolios or our multi asset funds. However, the multi asset funds for advisers, it does sort of covers that missing piece of the puzzle that we've always had. The way that you can now actually plan a little bit for CGT and then also planning for income needs because the funds will have income units available as well. So that's why we've launched the fund. The objective initially was to start with the tracker strategy. We wanted to replicate the timeline tracker. The reason why we want to do or why we've decided with the tracker portfolio is, first of all, flow. So currently, we have very strong flows in our tracker portfolio. It's slightly stronger than our classic model. And when you are launching a multi asset fund for the first time, it's important to get the blueprint and the infrastructure right and keep the cost as low as possible and to keep the cost as low as possible, you need to make sure that you have scale. So for example, it wouldn't have made sense to do the ESG strategies now, which has about twenty five percent of the flow where the non ESG strategies has about seventy percent of the current flows. We also came to or came together and talked about a pricing strategy. And what we figured out is that in order to launch a fund, we have to be competitive against I'm not going to call any names out there, but you have to be competitive competitive against your main multi asset funds currently in the UK. So we've set a pricing target at low 20s. We were very happy when we were able to structure the fund at a OCF of twenty basis points, which really allows us to actually be comfortable that we are adding value to the clients. If the funds were coming in at thirty basis points, I think it would have been very difficult for timeline to say that it's in the best interest of the client to invest in a thirty basis points tracker fund if there are other similar funds in the market available at twenty two or twenty four basis points. And then also, it was important for us to maintain independence, not go all in with one underlying fund manager, but actually use a multi manager strategy. It just shows our independence, and it's also something that the FCA likes when it comes to using multi manager strategies, not being fully invested into a single underlying manager. Right. So the main question that we get these days is other than why the tracker from a operational point of view is why the tracker from an investment perspective. Now most of you would probably know my view that I'm somewhat of a efficient market hypothesis. I am not saying the markets are perfectly efficient, but what I'm saying is that the markets have treated us very, very well. And our tracker portfolio, I'll share with you some stats later on, it has done really well over the last couple of years. And it's not because there was any secret sauce to it. It's not because there are any superior skills or any portfolio managers that can claim any credit for the performance of the tracker. Just the markets that were very, very efficient. And when we talk about markets as very efficient, the reason why we believe it's efficient is essentially because it's a rules based process. Yes, there are some human interventions if you design an index and that's a can of worms that we can leave for another day. The actual human interventions going on when you design an underlying index, but for all practical purposes, if we invest in a global equity market strategy or global bond strategy, what we are saying is we are going to invest in each region proportionate to that region's size of the global market. And that global market proportion or that global market cap positioning is just a reflection of where the aggregate of investors are expecting the highest returns. And this slide is probably something that you've seen many times from me. I love this slide because for me it shows that a global strategy, if you are really tracking the global markets and not taking any views on specific sectors or countries or even companies, your capital will be very dynamic. You can see the US currently, it is elevated. It is overpriced, but still there are some really attractive companies in the US. What we've also seen is that it's not unprecedented. We've had the US at at higher levels and we've had the US during the Japanese market bubble. We've had the US at the second largest company in the world at about twenty nine percent of the global markets. And this is how dynamic the the the the timeline multi asset funds are as well. Capital will migrate to where investors are expecting the highest returns. Should there be a new world power emerging, you can rest assure that our portfolio will also naturally migrate to that whatever the new country is that might be the next dominant equity market in the world. But then also from a risk perspective, this is just a brief exercise that we've done last year where we've looked at volatility of different countries. Actually, was surprised to see that over the last twenty four years, the United States were the least volatile market in the world and then followed as one would expect by your other efficient markets, Japan, UK, Hong Kong, France, and then you get into your more emerging markets, China, South Korea, South Africa. And the interesting thing is if you combine all these more volatile countries with the US, which is your least volatile, you get the light blue bar on the left hand side, which is the global markets. It's the multi asset fund or our tracker portfolio and it's actually less volatile than the least volatile country in the world. No rocket science behind it, it's just the power of diversification and it shows you that a global market strategy or a global market cap strategy, that's where supply and demand really is in equilibrium. Investors are really not just expecting the highest return, but expecting the highest return at the reasonable level of risk in this specific portfolio. So all of you have probably seen this SPIVA website before and if you've been on my course, you would also know that I'm not a huge fan of going into an activist passive debate and I also don't really like going on for too much about activist passive investments. I've dropped this slide in here just to show you that if you go on to this website, the s and p global dot com forward slash piva website, you can have a look at what percentage of active managers are actually outperforming or underperforming their respective benchmarks. And what you would see is that in most countries over a five years and then especially over a ten year and longer period, it's around ninety percent of active funds are underperforming their local markets. I'm not saying that to say anything about anti anti active positionings. What I'm saying is the reason why they are doing it is because the markets are super efficient and that's one of the reasons why we are comfortable with a tracker strategy. And just to show you on the Morningstar NPS database, our timeline tracker portfolio currently over five years is actually in the second position. Out of all your portfolios in the UK, it's about fifteen hundred portfolios. And again, as I've said before, there's no secret sauce to it. There's no credit that we can claim. It's just the markets that were really, really efficient. And yes, there were some concentrated drivers responsible for this return, but I've actually been at a very interesting talk yesterday at Deutsche Bank where the one guy said the concentration is not because of risk. The concentration is a result of actually companies that have done really, really well. So it's positive movements causing concentration and we do think that given the highly dynamic positions that we have in a tracker strategy and the fact that the underlying indices will automatically rebalance at least every month on the developed side, every quarter on the EM side and then there will be ad hoc rebalances as well. And that rules based approach will allow you to just stay where investors are expecting the next best thing. Now I always get told when I show these stats that I'm cherry picking just the good and that's not what I'm trying to do. When we talk about a market strategy, you have to be honest with yourself and you have to talk about the good, the bad and the ugly. So I will show you the actual expectations of what you are of what you can expect when you are investing in a multi asset fund or a global market cap strategy. This is just the hundred percent equity of our multi asset fund that we stress tested against past market events. And it is a reality that when there's a significant bear market, we all know bear are a feature of the system. They do show up from time to time. We know the whole story about how difficult it is to time it. And for those that have timed the bear market in the start of twenty twenty three, Yeah. I think we can all get the idea that high markets or irrational pricing can persist for much longer than me and you can actually stay liquid. So there are scenarios where a bear market will have a more aggressive impact on a global equity strategy as opposed to the industry average or your average active manager. Just to highlight the three main examples we've had in the last, call it, twenty years. Two thousand and eight, that was the GFC crisis. Equity markets were down twenty three percent. It's not I mean, it is a significant drawdown. If you compare it against individual markets, meaning individual regional markets, can see that it's much lower and that's because you get that diversification benefit between countries. Your average UK investor represented by the Morningstar target allocation benchmarks in the equity space were down about fifteen point six percent. So they were more defensive. There's two reasons for it. One is they were slightly more overweight to to UK equities, but also many active managers do actually position themselves to be defensive. And if you position yourself to be defensive, it's actually something that you can do with a certain degree of efficiency. Unfortunately, that does mean that you are sacrificing quite a lot of your upside as well. And ultimately, when the markets are spiraling down, I don't think there are many investors that can protect themselves fully. So you can see markets down twenty three percent, the average investor were down fifteen point six percent. We've seen the same in the COVID pandemic, markets were down thirty three percent, the average investor in the equity space down twenty four percent. And we've also seen that in April this year. Now COVID is probably still relatively fresh in our minds. April is definitely still fresh in our minds. And we've seen how quick these recoveries are. So that's the full picture when you invest in a global market strategy. Yes, when there's a market correction, the correction can be slightly more aggressive because the actual build up in the bull market were more in your favor and there must be some repricing in the global markets. But then also when there's a recovery in the market, we've seen how good global market strategies actually perform in the recovery. If you want to avoid these aggressive drawdowns, that's where we feel fixed income should be the asset class giving you that counteracting properties. I'm not going to share go into too much detail about all the other events, but we have actually stressed that some credit events in the equity space because what we've seen is that many equity investors do expose themselves to credit risk. And then for most of your other events globally where there were an equity market drawdown, we've actually seen the global or the UK peer investor having returned a very similar return compared to the global equities. They weren't able to be much more defensive, if at all. So that is the overview of why we've decided to launch the Tracker portfolio. First of all, it made sense from a commercial point of view given the flows and operations the operational ability. And then also, we have very high conviction in a tracker strategy. We believe that exposing yourself to market risk does actually result in very, very favorable results over the long term. What I want to do now is I want to quickly dive into the timeline multi asset fund structure and just show you what sits behind a multi asset fund. This might seem like a little bit of an overkill. You might ask why am I sharing all this detail. I do think especially for advisers, you're not gonna share this with your clients, but especially for advisers, it is important to know all the moving parts of a fund because then you can start to ask the right questions. Who is the actual owner of the fund? Who's the investment manager? Who's the accountant of the fund or the or the custodian of the fund? These are all important questions to ask and many people think that it's usually if it's a Vanguard fund, Vanguard owns everything, which is very rarely the case. So a basic layout of a multi asset fund looks like this. You can see there's many moving parts to to the multi asset fund. First of all, when you launch a fund, you are usually the investment manager, the sponsor, the manufacturer or the co manufacturer and also the distributor. So that's TimeLine's role in the multi asset fund. We've launched the fund. So we are the investment manager. We are responsible for distributing and manufacturing the fund. But then we thought by ourselves, we've done a lot of market research and we figured out that if we're going to do everything ourselves, appoint an independent ACD by ourselves and let them just choose the best custodian and depository out there, the average fee structure are going to run up quite a lot and it would have been a challenge to even get in at about thirty basis points, which wouldn't have made any commercial sense. So we went out to a lot of fund managers in the industry to ask them how we can work together to get a fund, to scale a fund and make sure that the cost structure is very attractive. We've been in contact with, and I can share with you, with Legal and General, Amundi, LGIM. We've had discussions with Vanguard, some third party fund managers abroad as well, and we've been in touch with external consultants. Ultimately, Northern Trust for us was the obvious partner to to to work with. One, because of their track record on the investment side, so we thought we can we can appoint them as the sub investment managers. So on the investment capability side, they will be running the fund for us on a day to day basis. And then also because of their scale that they have, especially in the institutional space, we thought, Northern Trust is one of the investment managers that do not have an internal ACD. An ACD essentially is the owner of the fund. It's called the authorized corporate director and the ACD's responsibility is to look after this interest of the end investors. They do not care about us, they do not care about Northern Trust and they do not care about the adviser. Their only responsibility is the end investor and to protect the interest of the end investor And that's something that we also felt would be very beneficial if we have an independent ACD apart from any fund managers that can actually have independent oversight of the fund as well. Northern Trust already has a relationship with Tutman and we were able to to leverage that relationship with them as well. Tutman was then appointed as the ACD and then Tutman appointed Northern Trust as the depository and the fund administrator. Northern Trust is the world's largest fund or asset service fund administrator and custodian. So given their capabilities and cost structure, they were the obvious choice on that side of the fund as well. And then ultimately, the building blocks of what you are invested in. For us, as I've said, what was important to keep your our independency, we wanted to maintain the usual Vanguard, LGIM, iShares and then also we are we brought in Northern Trust as a fund manager based on some really attractive pricings that we were able to agree with them. The fund itself is what's known as a nurse structure, a non usage retail scheme. Essentially, what it means is it's in the name, it's not a USITS fund, it's a UK domiciled nurse fund. There's a few advantages to using a nurse fund. The reason why we've decided to go with a nurse fund is because of client demand. From our side, there's one advantage to having a nurse structure and that is within a nurse structure, you have a maximum threshold of thirty four percent that you can invest per underlying fund, where in a usage vehicle, you're not allowed to invest more than twenty percent in an underlying fund. These regulations was actually developed for single securities, but ultimately because it's a fund of fund, the underlying fund is being picked up as the security. So even though there might be five thousand securities in the fund, you are not allowed to invest more than thirty four percent. That's one of the reasons why we've introduced more funds than we have in our tracker portfolio just to satisfy the nurse requirement on portfolio concentration. With a nurse fund or a UK fund, advisers told us that the FSAS protection is really important, especially from a client's point of view. We've worked with a lot of advisers and industry professionals to actually figure out is it really important and we find it very difficult to make a case for why FSAS protection is important in a fund structure that doesn't run any cash. The fund itself is not managing any of the underlying capital, the assets are ring fenced by the independent custodian. So the fund itself might have a few basis points of cash that could be mismanaged for which FSAS protection will be more than sufficient. But ultimately, it's very difficult to see a scenario where FSCS protection in a fund will be applicable or where an an investor will be able to claim from a fund. For take, for example, the Woodford scandal, the FSCS doesn't protect against declining asset prices. So investors with the Woodford scandal weren't able to get FSCS compensation. And then also probably the biggest benefit of having a UK structured fund is excess reportable income. We've had a lot of clients telling us that they are struggling to get excess reportable income number from some platforms because they're just not reporting it. And if it's not if it's not reported by the platform, how is it possible to get the numbers? That was one of the reasons why I've decided, okay, let's just do a UK nurse vehicle and that should actually help quite a lot with the ERI problem that advisers are facing. And then finally, just to a little bit of more info on why we've decided with Northern Trust as both the sub investment manager and also as an underlying fund manager in our in our funds. First of all, their asset and investment management capabilities. I mean, it's a one point last time I checked, point six trillion dollar fund manager. They've got a track record since, believe, the eighteen sixties or eighteen eighties, so a very, very long track record. They've they've seen all the possible cycles and all the world events. They are an institutional house. They do not compete directly with us, so there's not a lot of well, there's not there's no conflict of interest. If we have taken somebody, let's say another fund manager that also has a multi asset fund in the retail space, we felt there could be some conflicts of interest as well. Then also the cost efficient opportunity carried a lot of weight. The institutional asset servicing capabilities is really important where they can actually manage the fund on day to day basis. And then as I've said, the track record. All of this just added up to be a very to put Northern Trust in a very favorable position to select them as a partner in structuring this fund. Now the one question a lot of you might have is, you've talked about the tracker portfolio that you've replicated, although you do not see the word tracker in any of our font names and there's a very good reason for that and you are you would be right to think that. Initially, I'll give you some inside info here, but initially, when we wanted to launch the font, we our initial application of the FCA was actually to call the fund the TM timeline tracker funds. And the FCA felt that it could be misleading for end investors if you say tracker because we are not tracking a underlying licensed index. We are a fund of fund and we are tracking many underlying indices. So a tracker fund wouldn't be the word tracker wouldn't be accurate. They suggest that we use the word passive. We just felt most passive funds in the industry, one is not passive. They use passive instruments to be very, very tactical and also a timeline, we don't like the word passive because we don't think you have to be agnostic about the market to believe that a tracker strategy is actually a very useful or a strategy that will give you high returns. You have to understand what you let yourself into and you have to know what's driving your returns in your portfolios. So the word better felt a little bit agnostic and therefore we've just decided to call it the timeline fund. The thirty percent to fifty percent equity, fifty percent to seventy percent equity is another annoying point that I just wanted to address. Just calling the fund a forty percent equity fund would have meant that we had to get rid of our ten percent rebalancing methodology. Again, the FCA felt that if a fund can actually drift ten percentage points up and down, that should be disclosed in the most obvious form and the most obvious form is in the name. So we had to decide or we had to call the fund, the timeline thirty percent to fifty percent equity. Although if you see fifty percent to seventy percent fifty percent thirty percent to fifty percent or fifty percent to seventy percent equity, the strategic asset allocation is just the midpoint. And the so for example, the timeline thirty percent to fifty percent equity fund is a replication of our TRACKER forty, TRACKER sixty, tracker eighty and tracker one hundred. I use the word replication very loosely because it's not an exact replication. It is mirroring the tracker fund when it comes to underlying securities. But when it comes to underlying funds, it's not one hundred percent the same. And our tracker fund currently on the fixed income side, we use all Vanguard. We've decided that we can now introduce two Northern Trust bond funds into the fixed income side as well, very similar to the Vanguard bond funds and the Vanguard short dated bond fund. Both of them are float adjusted, meaning these indices are tracking the investable universe where most other fixed income funds are just tracking the universe. And the whole universe is not necessarily invested or investable. So that was a key point for us. Northern Trust is using Solactive as an index provider, a large German index house where Vanguard is using Bloomberg. But other than that, the underlying indices are very similar. The three Vanguard funds that's still in the in our multi asset fund are the three funds that's in our tracker MPS as well. And then on the equity side, the first three funds, the two LGIM funds jumping ahead, the two LGIM funds and the iShare funds. I've got old fingers today. There we go. So those first three equity funds are the ones in our tracker portfolio. As I've explained, because of the nurse guidelines, we had to introduce more underlying fund managers. There's not a lot of benefits to introducing more underlying fund managers. If you can find fund managers that are just as effective, it's not a negative. So we've we're comfortable doing it. So we've introduced Northern Trust World Equity. It's just a MSCI World Equity Fund because it's now an MSCI World or MSCI developed world. You have to match the emerging markets part with an MSCI Emerging Markets Index. Otherwise, you would end up overweighting or just completely excluding countries such as South Korea and Poland. And then we've also brought in the Vanguard FTSE developed world fund. For full transparency, of I probably shouldn't disclose it now in an open webinar, but for full transparency, we are actually currently reviewing our track holdings as well to see if there are any improvements we can make to our tracker strategy should it fully replicate our multi asset fund from a cost perspective and can it be justified. So the tracker allocations are actually under review and we will be in communication with all clients as soon as we have inform more definite information on that as well. So ultimately, we do expect the two multi multi asset fund and the tracker to sort of converge a bit more to each other. And then maybe given what I've just said, if you are a user of our tracker NPS strategy, we've heard a lot of advisers saying that they get uncomfortable with having eighty eight percent of the equity in a legal and general index fund. So maybe in the chat box, drop us your views. Do you think it would be a good idea? Wouldn't it a good idea? It's always good to have clients' insights into that as well. So just finally, before I quickly jump into ControlCenter, I want to share with you the backtested results of our multi asset fund compared to our tracker portfolio. Please read the source note because it's a full disclosure on the backtested performance that we've used. You might think that we've just used the timeline tracker portfolio as the backtested results. We actually haven't done that. The the the way we structured this backtested performance is since twelve August twelfth of August when the funds was launched, it's the actual fund underlying holdings. Predating August, We've used either share classes of the multi asset fund that were available or a different share class. If a different share class wasn't available, we would have used a underlying fund that that that's tracking the exact same index. And if that wasn't available, we would have we we've looked for a alternative index, but that's tracking the exact same investment universe. So it just gives us the best backdated performance to to to backtest the performance of the multi asset fund. So what you can see the tracker thirty to fifty percent equity, well, the timeline thirty to fifty percent equity fund is a very close replication of the tracker forty percent fund. The fifty to seventy closely replicates the sixty, same for the eighty and then also the same for the one hundred percent equity fund. I'm gonna jump into our control center in a second just to show you over a very short period of, let's say, a year or even a month, you shouldn't expect the funds to perform exactly the same because it's a two different vehicles. Prices during the day will be different. I mean, if if if a S and P five hundred or a developed world index prices at twelve o'clock and the other one prices at five o'clock in the evening, that makes a huge difference. And it could actually be a couple of percentage percentages, not just basis points on a day to day basis. But over the long term, we do actually expect these funds to be exactly the same. And then also with a multi asset fund, you have a unique cost structure and unique transaction fee structure. So you really have to look over extended time periods to see the exact resemblance, but the trend will be the same. Just to show you the underlying holdings, in terms of size of these companies, you can see it's exactly the same few basis points here and there that would be because of different underlying index providers. Same with your style, it's actually precisely the same. You would expect a growth value blend makeup of the markets to be indifferent. The next couple of slides, I'm just going to leave it there. It shows you the NPS funds compared to the multi asset funds. We will share the slides with you afterwards as well if you just want to run us through that. And then ultimately, this is something that just might be interesting to you. But when we select funds, you have to look at you have to go into underlying securities and where they are domiciled. And this just looked at the differences between dividend withholding taxes between the UK and every single underlying country. It's some work that we've done to optimize our multi asset fund to make sure that our developed world funds are paying the optimal dividend withholding tax and not overpaying dividend withholding tax because ultimately taxes are just another form of fees that we can't avoid. So that's it from the multi asset funds point of view. I'm just gonna pause there to see if there's any questions before I do a deeper dive into ControlCenter. So we haven't got any on the q and a, but there is a time. There is options. So if you do have any guys, obviously, just absolutely get involved, and we can we can answer them. But no. They're interested. If you wanna have a little go and see, see, and we can we can go from there. Thanks, Jay. Keep in mind. Right. So all clients We have got one. Here we go. Question. Right in the nick of time. So how would have you can you say it? Or is it really out? Read it fast, please, Jake. Okay. How would you explain to a client why you would pick multi asset over NPS and vice versa? Great. So this is a it's a question that we have actually had to taste with our advisers as well. And thanks for the advisers that participated in giving us their views on it as well. Multi asset funds, the obvious one is NGIAs for CGT planning. So what we can do within the multi asset fund now, we can rebalance, we can make changes. We we do not have to trigger CGT events in a multi asset fund where in a MPS, it's you are exposed to each underlying line item. So when we rebalance, it triggers CGT or when we make a fund change, it does trigger CGT. So that's the obvious one. There's advisers that prefer to MPS products as far as possible and don't use multi asset funds at all. There's advisers that use only multi asset funds and do not like model MPS products. On the MPS side, if you just look at the tracker portfolio, our tracker comes in at nine basis points and then nine basis points for the the for the DFM fees, we're paying eighteen basis points. The multi asset fund is twenty basis points. So not a huge difference in cost. It is fairly similar. One could argue that an NPS product is slightly more cost efficient. And then also if you have clients that want a natural income or a distribution share class, The income or the funds that we are launching are available on in income units. The ones on control center is just our act units. I will show you where to get the income units as well, but please reach out to us if you need any more information on that. And then, I guess, probably from what we could say that tell from advisers is it feels like they it's sort of two sides of the spectrum that attracts a multi asset fund over an MBS. The one is your very large GIS for the CGT or the the tax implications as I've discussed, but then also for your smaller end of the day clients, maybe younger clients, just getting started doing do investing. They might not be ready for a fully fledged Miles per hour product and the multi asset funds could be beneficial for them as well. Perfect. I hope the help that was from Imelda. Think we're ready for the question. I hope they helped. Let us know if you need any more clarification. We do have just one more from DCE Hindley, DCE Hindley. What are the yields on the new funds? Good. So yields on the fund, I'll I'm gonna refer to the fact sheet to give you the exact yields of the funds. Yield is quite a it's quite a difficult thing to measure. If you go into our analytics, you'll see our historic yield. But then if you look at things like a ACK fund, half of the fund managers in the UK report historic yield with ACK funds, and the other half of our fund managers are saying, well, the fund hasn't distributed anything, so the yield is zero. So it's very difficult to actually calculate the yield. I'll show you on our fact sheets. Maybe that's the first thing to do. If you go into our control center under resources, the fact sheets will show up in other parts of the control center as well, which I'll share with you. For now, if you go into resources, timeline, multi asset funds, you can see there's the timeline fund fact sheets. Let's use the fifty percent to seventy percent, the sixty percent equity fund. It just could be download the fund, open up the multi asset or the fact sheet. We've received feedback after last month that the fact sheets should rather be in a printable format that has been taken note of and next month, hopefully, the printable format will be ready. So ultimately, the income yield for the tracker strategy, two point three eight percent. That is the yield that is determined by the current yield. So historical yield could be slightly higher or slightly lower what was distributed over the last year. Currently, the actual dividend yield of the equities and also the current yield of the fixed income funds is paying two point three eight percent. Great. They are all the questions for now. So thank you very much for them, everybody. I guess we've got about twenty more minutes to do this, and then we could do another ten minutes of questions. So I assume you'd answer if you guys if you do have any more, absolutely just put them involved. Yeah. Absolutely. So we've sent out notifications yesterday to all clients notifying them that the TM timeline fund is now available on our timeline app or, as I call it, the control center. I do just want to caveat that our control center was initially built as a model portfolio service. So it was quite difficult to get the exact fund data into our control center in a format that makes sense. So I'm going to share with you the underlying. Everything seems in order at the moment. There's one slight issue we have on the thirty percent to fifty percent equity fund, and that's a Morningstar issue where they are counting nine percent additional equity, which shouldn't be there. We are working with Morningstar. It's an API feed from Morningstar that we have. But if you look at the underlying fund holdings, you can see growth assets for this fund forty. This one has already drifted two percent, eighty one percent and one hundred percent. Portfolio OCF, twenty basis points flat. Transaction costs, we've had a lot of questions about transaction costs and how transaction costs are being captured in a multi asset fund. MiFID actually requires the underlying transaction costs to feed through to the multi asset fund or the fund of fund structure as well. So what you are seeing here is the full picture. You do not have to calculate the underlying transaction cost of each underlying fund. For most multi asset funds, our funds actually really straightforward with just about ten holdings. But for most multi asset funds, that would be an impossible task to do in any case because they would have north of forty underlying funds. So the transaction cost that you're seeing is actually reflecting the underlying transaction costs as well. You will only see one fund because it is a unitized fund. Underlying holdings, again, this is now where you have to rely on data vendors to give you accurate information. What I can say is eight thousand eight hundred secondurities is what you get when you sum all the underlying fund securities. There will be some double counting. We know that in an MSCI world, well, MSCI ACWI and the FTSEO world, you have roughly about four thousand securities. But still, I mean, four thousand, eight thousand, it is a highly, highly diversified fund. And then you have about eight thousand bond securities as well, which makes up a total in your multi asset ones, a total of about twelve thousand securities. You can see the underlying funds. To see more details of the underlying funds, jump to the funds section. In the funds section, the kids, fact sheets and prospectus or actually the kids and fact sheets will feed through from Morningstar in the near future. We are trying to work with the Morningstar to to update more frequently, but that's why in the meantime, we've made it all available in the resources. Here you can see the ice and codes again, OCF and transaction costs, and then you can also have a quick view of the performance. The risk of the funds, you will see that it is the exact same as our tracker portfolio. We haven't mapped our multi asset funds against de facto dynamic plan and all the likes for a very simple reason and that's commercial. It would cost a well in the six figure sum just to map the multi asset fund against the external rating agencies. Commercially, that wouldn't make sense for us. And then ultimately, that cost had to be fed through as well. So we felt it's in the best interest. It is a close replication of the tracker strategy. So hopefully, you can take guidance from our tracker portfolio. But please get in touch with us if you have any other questions. We have a document as well going in more detail about the similarities between tracker and the multi asset fund. If you want to have a look at that as well, we will probably upload it sometime next week on control center. And then you get the same backtested results as with our tracker portfolio, and that is essentially performance data. You can see performance data, I just have to caveat, we are not showing back tested performance for our multi asset funds. The reason why we are not doing it is we want to align our performance reporting with your global investment performance standards or your keep standards. And if you're gonna show back these results, there's specific ways that you have to disclose it and use the exact same underlying indices, which is not something that that that we can do at the moment. So we are showing you performance since launch, which was twelfth of August. You can have a look and compare it against underlying indices. And then for if you want to see the back tested results, I've created and I've deliberately called the name or or structured the name in a very unattractive way so that you know it is the back tested version of the portfolio. Get in touch with us if you want us to make this available to you that gives you the under or the backtest results. You can actually go into if you go into your settings side of the portfolio, you can download the historical holdings to actually see what the backtested proxies are. The reason why we haven't made it available to all clients from the outset is because if you build a backtested portfolio, it will show as a portfolio. So you will actually see the underlying holdings. The underlying holdings is going to reflect the actual cost of the underlying holding and not the cost of the multi asset fund and also not the cost that we are paying in the multi asset fund because we've made agreements with funding the underlying fund managers. So the cost structure that will be or won't be one hundred percent accurate. And then if you go into analytics, this is now also where you will be able to see the font. I think if I click on this one, it might be already loaded. The font will be under your internal model. You can select let's select the backtested version fifty to seventy, and we compare it against the tracker, sixty. Here, you can see portfolio cost on the back tested version won't show. We we don't want it to to show. I can bring in the actual fund in a second, and then you'll see why we are not showing it. Performance wise, here you can see the actual backtested performance. So it is very similar, especially we've had a lot of advisers telling us they plan to switch from the tracker to the multi asset fund for CGT purposes just before year end and then switch back to the tracker portfolio. I can't give any financial advice, but that's what the feedback that we've had from many advisers that they will do as well for CGT purposes. You can have a look at the underlying funds, portfolio structure, regional allocation, top holdings, etcetera. And then just finally, the last point that I've mentioned earlier is if you look at a very short time period, the TMTimeline multi asset fund, to seventy, The performance will only show since the start of the fund. So you can see we don't have full performance track record. You can also see the pricing points every single day is slightly different, but ultimately, the fund is tracking the tracker portfolio very closely. This dip here at the start, that's something that's being sorted out with accounting. It's just an accounting in the early seeding days of the fund that they said will be fixed year end, but we want to get it fixed sooner. But as you can see, it was just a write up and the performance was exactly the same. Our first investors came into the fund mid September. So that is everything that I had to share. I've had the question in the past who actually seeded the fund. It was seeded internally by staff of Timeline. So it also just shows you a little bit what the conviction of the Timeline team is in our multi asset fund. We are really proud of this of the structure that we were able to launch and think it's gonna be a really useful tool for our adviser base. No. That's perfect. Thank you, adventures, for all of that super helpful information. And we are running, like, slightly, like, on time, which is really good. So we we have got ten minutes of questions. If you guys do want to know or need to know anything, literally just put them in. If you wanna get involved in the chat, raise your hand. I can put you on the panel so we can have a sort of conversation. So we can give one or two minutes over then. And I I I always welcome critique as well. You don't have to ask a a polite question. Feel free to give us your view or any Yeah. You might have as well. Ultimately, I think our feedback thus far from client events and just client calls was really positive about the funds. Okay. We I guess we hope so. That's what the other. Doesn't look like we do have oh, no. Here we go. Hopefully, they're gonna start flooding in. Oh, we got it. This is from Bruce. Bruce Hormann. Hi, Bruce. The entire seed amount was funded by staff as in entire, like, in Asterisk? Yeah. Yeah. Bruce, good good question. So underlying funds were seeded. That wasn't done by the by by timeline. The multi asset fund, the fund of fund in their structure was seeded by timeline staff. Yes. We were not going to use well, first of all, we are not going to use clients' money to seed the fund. That's one of the things that timeline has always been quite adamant on. We are not an institutional manager. Institutional managers do that. They use client funds to seed to seed new funds. We are investing in preexisting funds. The multi asset funds because we are the manufacturer and the sponsor of the fund, it had to be seeded and we felt that well, let's seed it ourselves. Are there any plans to make timeline funds available direct to clients? I'm going to answer that one again. Bruce, I'd like to just get your insight as to whether you see that as a good or a bad thing. But the what I can tell you, the entire amount is a couple of thousand pounds, it's not millions. We do not have millions of pounds hidden in TimeLine staff pockets, but it was a couple of thousand pounds that was used by TimeLine staff. Are there any plans to make TimeLine funds available direct to clients? Short answer, no. TimeLine has always been an adviser led business. I think if you if you ask Abram his view, he would just start to laugh at you because it's a it's one of those things that come sort of just out of or that that that we think it was never even under discussion. We are distributing our funds through advisers and not direct to consumers. There are some caveats. You will pick up. There's a B share class. Probably after the day, you'll never even hear me mention the B share class because the ACD is only responsible to the end investor. If an end investor approaches the ACD directly and want to invest in the fund, they can't refuse the end investor. So we've launched the DGA class that's actually more expensive and it has a minimum investment amount just to say, well, okay, if there's somebody going directly to the ACD, there's something available for them. Ultimately, it makes more sense because through an adviser, you can get the A share class at twenty basis points. Chris, it would be good to have a client facing brochure, please, along similar lines to the adviser only version. I will take that feedback up with the team, Chris. Yes, I agree with you. They should be because the fund is there for retail investors to invest in. So communications, we always try to make the communications clear so that end investors can also or retail investors can understand them. So I'll I'll take that back. Just we have to think about the compliance things. I don't know if we can send out a document to say for retail clients only, but I think it's sort of a standard thing to say for for advisers only, but we will I'll I'll get back to you on that one to see what we can do to accommodate the end investors. And then are the distributions on the forty percent fixed interest low interest and lower treated as a dividend or interest? Are the distributions on the forty percent fixed interest? Oh, good question. Yes. Yes. So the question is whether our funds are distributing dividends or interest. That comes down to a regulatory requirement, which is the forty percent rule. That's why you're asking the forty percent one, Imelda. And it's a it's a really good question. So all our funds short answer is paying dividends, not interest. Basically, what it means is if there's more than forty percent equity in a fund, it it should distribute dividends. If it's less than forty percent equity, it can distribute interest. It could be that the fund, in theory, drifts down to thirty percent equity, and then it will distribute interest that I we can't see happening. We can see a market crash at some point and probably have somewhat of a negative drift if there has been a rebalance. But even then the markets it will only pay interest if the markets doesn't recover for a full year. It has to be less than forty percent for a full year. So short answer, funds are paying dividends, but just caveat, it is theoretically possible for the forty percent one to to pay to pay interest. Anyone oh, anyone here we go. From Chris? Will the income tax be available in analytics? I can't see that at the moment. Yes. Let me Chris, for now, let me quickly share my screen again just to show you on the fact sheets. You can find the income share class ISEN code right there. Let's get rid of this. So the income ISEN share class, you can find on the fact sheets. Currently, the income versions is available on FE. It's available in Morningstar. It's not available in our control center. We've sort of had a discussion this week whether we should do it because I know some clients wants to keep their control center as neat as possible with as little products available in it as possible. What I will do, Chris, is I will build out the in conversions and make it available to clients that that require them and probably send out a note about that as well. So thanks thanks for that. I think we might be there. So I'm gonna start doing sort of the wrap up now. If everyone's got any questions in between Yeah. Yeah. Just for the end. Absolutely. Yeah. Just just seeing the feedback from Bruce. Now, Bruce, thanks for for that question about the seeding, and I I get where it comes from. If you think about a fixed income fund, usually, if you see the fixed income fund, you want about sixty to one hundred million pounds. So so so yes, no. The funds that we've ceded is just the fund of fund level. All underlying funds were already ceded. So the the requirement was very, very lower. Well, thank you everyone for coming, guys. That is that is essentially essentially it. We know it's a busy time in November in general, especially of yesterday. We're also very thankful the webinar didn't leak, you know, thirty minutes before it was due to go on air, so that's good so you could all join, which is great. So you'll receive the follow-up. You'll receive absolutely everything. If you do have any questions in the meantime or if you need to know anything, just get in touch with us, and we'll be happy to help everyone. Can someone come in? We can do that. We can make sure. Yeah. And we'll get somebody to be in touch with you. Yeah. Absolutely. So, yeah, thank you very much for coming, guys. Thank you for your questions, the feedback, all that sort of stuff. The last timeline sort of webinar of the year, we'll see you in twenty twenty six for a load more stuff. We got a lot of things coming up. We've got a growth series as well in the New Year as well. So if there's if it's around by town near you, city, town, anywhere, please have a look. And there's been a lot of us going. There's still tickets available, and it'd be more kind of reference I was gonna say. Kevin, there's one question that came through about how do we see the growth in the multi asset funds. Short answer, if you take GIAs as a proxy, we expect about eight percent flow into the multi asset funds opposed to our NPS. We've had some or some large adviser firms reaching out to us and say, they only wanna use the multi asset fund and not gonna use NPS. So we expect significant flow into the multi asset fund. But just like with any NPS product, you should expect it to be to happen on client review events and we don't expect any immediate point where the flows are going be really aggressive. But currently, we are seeing strong flows into the multi asset fund, which is encouraging.