
Why Domicile Doesn’t Matter
The most important factor determining the level of risk and variability of return in a portfolio is asset allocation. A 1986 seminal research paper by my first employer, Gary Brinson, demonstrated that 93.6% of the average return variation in US pension plan portfolios could be explained by asset allocation.[1] This has been confirmed multiple times in subsequent studies: asset allocation drives return; stock selection usually has a negative impact and market timing is practically guaranteed to destroy value.[2]
The most important decision to be made in asset allocation is the split between equity and fixed income. And this responsibility rightly rests with the financial adviser as this ratio is the key driver of portfolio risk and return outcomes and must be aligned with the individual client’s needs. As portfolio managers, we must decide how to allocate within those broad asset classes.
Here in the UK, in the growth segment of the portfolio, there has been a historic tendency to allocate predominantly to UK equities, with a smaller allocation to world ex-UK markets. This is apparent in the number of UK only equity funds available alongside the plethora of “world ex-UK” or “international” funds. The UK is not alone in this. In my past life as a global equity fund manager, I was responsible for global ex-Japan, ex-US, and ex-Switzerland portfolios, to name but a few, that sat alongside larger home-market portfolios to be used by clients depending on their domicile.
Country of listing is not country of exposure
It is natural for clients to feel more comfortable investing in their home markets, including familiar companies with high street names. However, this home bias is less relevant in today’s global capital markets. Many large companies now operate global supply chains and digital platforms, meaning their economic footprint extends well beyond their country of listing.
A company’s country of listing or incorporation is often a poor guide to the economic factors that drive its performance. Investors are ultimately exposed to where a company earns its profits, not where its shares happen to be listed. Owning predominantly UK or US stocks therefore does not mean investment outcomes will be driven mainly by the UK or US economy.
The table below shows the largest ten stocks in the flagship global equity index, the MSCI World. Although these companies are listed and incorporated in the US, their revenues are globally diversified. On average, only 47.5% of their sales come from North America, meaning more than half of their revenues are generated elsewhere.
This illustrates an important point: investors are buying exposure to global businesses rather than to a single domestic economy. Global revenue exposure naturally diversifies economic risk within individual companies, and focusing solely on listing location can therefore create unnecessary concentration rather than improving diversification.
|
Company |
Mkt Cap |
Index Weight % |
Sector |
% Sales from North America |
|
NVIDIA |
4,170 |
5.5 |
IT |
46.9% |
|
Apple |
4,060 |
4.6 |
IT |
40.7% |
|
2,920 |
3.6 |
IT |
51.0% |
|
|
Amazon.com |
2,380 |
2.7 |
Consumer Discretionary |
68.3% |
|
Alphabet A |
4,000 |
2.3 |
Commercial Services |
48.0% |
|
Alphabet C |
1.1 |
|||
|
Meta Platform A |
1,700 |
1.8 |
IT |
44.2% |
|
Broadcom |
1,470 |
1.8 |
IT |
29.6% |
|
Tesla |
1,240 |
1.4 |
Consumer Discretionary |
50.2% |
|
JPMorgan Chase & Co |
853 |
1.0 |
Financials |
62.2% |
|
|
|
|
|
|
|
|
Total Index Weight %: |
25.8 |
Average % Sales from North America: |
49.0% |
Source: MSCI World (2026)[3]
We see a similar picture if we look at the UK stock market, as represented by the FTSE All Share Index:
|
Company |
Mkt Cap |
Index Weight % |
Sector |
% Sales from North America |
|
HSBC Holdings |
220,527 |
7.8 |
Banks |
6.4% |
|
AstraZeneca |
203,674 |
7.2 |
Pharmaceuticals and Biotechnology |
43.0% |
|
Shell |
161,437 |
5.7 |
Oil Gas and Coal |
22.9% |
|
Unilever |
105,869 |
3.8 |
Personal Care Drug and Grocery Stores |
22.0% |
|
Rolls-Royce Holdings |
102,617 |
3.6 |
Aerospace and Defence |
31.4% |
|
British American Tobacco |
93,009 |
3.3 |
Tobacco |
43.6% |
|
GlaxoSmithKline |
74,915 |
2.7 |
Pharmaceuticals and Biotechnology |
51.6% |
|
BP |
72,664 |
2.6 |
Oil Gas and Coal |
31.1% |
|
Rio Tinto |
69,596 |
2.5 |
Industrial Metals and Mining |
17.0% |
|
Barclays |
67,595 |
2.4 |
Banks |
32.8% |
|
|
1,171,903 |
|
|
|
|
|
Total Index Weight |
41.6 |
Average % Sales from North America: |
32.8% |
Source: FTSE All Share (2026)[4]
The top ten holdings of the broad UK index generate, on average, 32.8% of their revenues from North America. This table also highlights the concentration of the UK stock market, with the top 10 constituents accounting for 49.0% of the index. These companies operate globally and derive a substantial portion of their earnings from outside their country of listing.
This level of overseas revenue exposure is only modestly above North America’s share of global economic output, which is approximately 25.7% of global GDP, according to International Monetary Fund estimates[5]. In addition, research from FTSE Russell (London Stock Exchange Group) shows that the FTSE 100 is highly international, with over four-fifths of its revenue generated outside the UK[6].
Any comfort that UK investors might achieve from investing in the “UK” as a domicile should therefore be viewed cautiously. The performance of these companies is largely driven by global demand, sector dynamics, and international pricing, rather than by domestic economic conditions. In practice, investors in UK listed equities are gaining exposure to global businesses rather than solely to the UK economy, and similarly with US stocks.
Real differences of listing location
We should also bear in mind that what we are talking about here is largely the country of listing. When a company decides where to list its shares and raise funding via an Initial Public Offering (IPO), it has a choice of markets, and there can be real world consequences depending on the listing requirements, governance rules and investor base of each exchange. A company’s choice may therefore reflect capital market considerations rather than the underlying location of its business activities.
Not all listing venues are equal. Listing standards and costs vary across exchanges, and these differences can influence where companies choose to list. In the UK, the listing regime has become significantly more flexible following the 29 July 2024 implementation of the new Equity Shares (Commercial Companies) category, which replaced the previous Premium and Standard segments with a single category. The reforms simplified eligibility requirements, removed mandatory shareholder votes for certain significant transactions and increased flexibility around dual class share structures, with the aim of improving the competitiveness of UK markets while maintaining investor protections[7].
At the same time, other exchanges have also adapted their frameworks. Hong Kong, for example, allows large issuers to operate with a lower minimum public float of 10%, provided minimum market value thresholds are met, reflecting a broader global trend towards balancing liquidity requirements with issuer flexibility[8].
These regulatory differences help explain why a company's listing location does not necessarily reflect where it does business. Listing decisions are often strategic capital market choices rather than indicators of economic exposure. For example, UK-based semiconductor designer Arm chose to list on Nasdaq in 2023 to access deeper technology-focused capital markets and higher investor familiarity with growth technology companies, despite its UK heritage. Similarly, many internationally focused companies consider multiple exchanges before listing, selecting venues based on valuation potential, liquidity, analyst coverage or governance flexibility rather than domestic economic alignment.
The key implication for investors is that listing location should not be confused with economic exposure. A company listed in London, New York, or Hong Kong may derive most of its revenue globally, and the choice of exchange often reflects regulatory structures and investor demand rather than where economic risks and returns truly originate.
A word on currency
Listing location can influence the currency in which investors experience returns, but currency exposure itself is often managed independently of where a company is listed. A UK investor buying US equities is exposed both to equity market movements and to changes in the exchange rate between sterling and the US dollar. Over shorter periods, currency movements can materially influence outcomes even when the underlying company performance is unchanged, a feature well documented in global investing research which shows that exchange-rate movements can significantly alter international investment returns[9].
The contrast between 2022 and 2026 illustrates how currency effects can move in either direction. In 2022, the US dollar strengthened sharply while sterling weakened, meaning UK investors benefited from a currency tailwind that partially offset declining US equity markets.
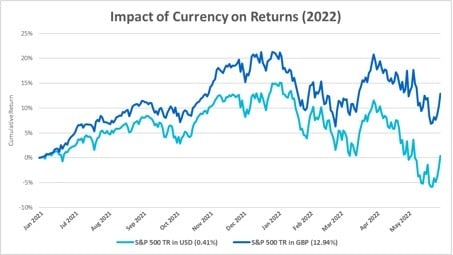
Source: Timeline (2022)[10]
By 2026, the picture had reversed: a weaker dollar and a stronger pound created currency drag, reducing the value of US equity gains when converted into sterling. These shifts highlight that currency effects are cyclical and can amplify or reduce returns regardless of where a company is listed.
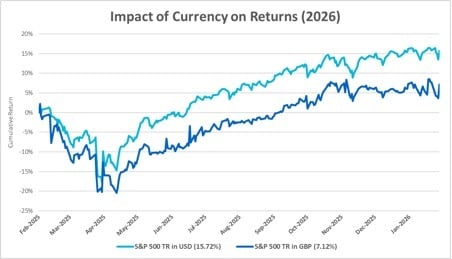
Source: Timeline (2026)[11]
Importantly, large multinational companies actively manage currency risk at the corporate level. For example, BP explains in its annual reporting that foreign exchange exposures are centrally managed and that residual risks are controlled through derivatives and netting arrangements. This means that part of the currency risk international investors take on is already being managed within the company, rather than determined solely by listing location or investor domicile.
Many global businesses also benefit from natural hedging, where revenues and costs arise in multiple currencies and therefore offset one another over time. Financial hedging programmes are used to manage remaining risks and stabilise earnings, particularly in globally traded sectors such as energy and commodities.
From a portfolio perspective, equities remain significantly more volatile than currencies over the long term. Recent research highlights that equity market swings typically dominate currency fluctuations, which helps explain why hedged and unhedged global equity portfolios often show similar volatility outcomes over time[12]. This is one reason why many global equity investors choose not to fully hedge currency exposure, accepting short-term currency fluctuations as part of diversified long term equity investing.
At the same time, currency exposure can be separated from the underlying investments themselves. Index providers offer currency-hedged versions of global equity indices, allowing investors to adjust currency risk without changing the underlying companies held in the portfolio[13]. This demonstrates that currency risk is an overlay decision rather than something inherently linked to domicile or listing location.
Academic research also shows that exchange rates interact with equity markets through broader global financial conditions, reinforcing the idea that currency effects are cyclical and macro-driven rather than determined by where companies are listed.
The key point is that currency movements can either enhance or detract from returns depending on the cycle, but they do not change the fundamental economic exposure of the underlying companies. Currency risk is dynamic, managed at multiple levels, and separable from portfolio holdings. It should therefore not be confused with the country in which a company happens to be listed, reinforcing the broader conclusion that domicile and listing location are often weak indicators of where economic risk truly lies.
So, does domicile matter?
Today’s investment markets are increasingly global, and country labels are often a poor guide to where risks and returns actually come from. The evidence in this paper shows that where an asset is listed, issued or domiciled does not necessarily reflect where its underlying economic exposure lies. Many companies and issuers operate across multiple regions, earn revenues globally and manage currency exposures actively, meaning outcomes are driven more by global conditions than by any single domestic economy.
The analysis across global and UK markets shows that economic exposure often extends far beyond the country shown on a fund factsheet. Changes in listing rules and exchange structures also demonstrate that domicile and listing location are frequently shaped by regulation, liquidity and investor access rather than underlying business or economic activity. Currency effects reinforce this point. As shown by the contrasting environments of 2022 and 2026, exchange rates can materially influence short-term returns, yet these effects are cyclical and can be managed separately from the underlying investment exposure.
For long term investors, portfolio outcomes are driven mainly by asset allocation, diversification and the underlying economic drivers of the assets held, rather than by domicile labels. Over time, market fundamentals and broad global growth have a greater influence on returns than the country in which an asset happens to be listed or issued.
The key takeaway is simple. Country classifications remain useful as descriptive labels, but they should not be treated as reliable indicators of economic exposure. Focusing too heavily on domicile can create unnecessary concentration and a false sense of familiarity. A globally diversified approach, based on broad market exposure and the global opportunity set as reflected in market prices, is more consistent with how modern financial markets operate.
In short, investors gain exposure to global economic activity, not to a single country, simply because an asset is listed or domiciled there. Listing location and domicile may affect reporting or operational details, but they do not define where long term risks and returns truly arise.
References
Bank for International Settlements. (2022). Dollar beta and stock returns (BIS Working Paper No. 1000). Retrieved from https://www.bis.org/publ/work1000.htm
Blake, D., Lehmann, B., & Timmermann, A. (1999). Asset Allocation Dynamics and Pension Fund Performance. The Journal of Business, 72(4), 429-461.
Brinson, G., Hood, R., & Beebower, G. (1986). Determinants of Portfolio Performance. Financial Analysts Journal, 39-44.
Dimensional Fund Advisors. (2025, October 28). Currency Hedging? Consider the Asset Class: https://www.dimensional.com/be-en/insights/currency-hedging-consider-the-asset-class
Financial Conduct Authority (FCA). (2024, July 29). FCA overhauls listing rules to boost growth and innovation on UK stock markets. Retrieved from FCA: https://www.fca.org.uk/news/press-releases/fca-overhauls-listing-rules-boost-growth-and-innovation-uk-stock-markets
FTSE Russell / London Stock Exchange Group. (2024, March 5). The UK’s very global country index. Retrieved from LSEG Insights: https://www.imf.org/en/publications/weo/weo-database/2025/april
Hong Kong Exchanges and Clearing (HKEX). (2026). Listing Rules - Minimum Public Float Requirements (Rule 8.08A). Retrieved from HKEX Rulebook: HKEX Rule 8.08A
Huang, N., Jiang, S., Sun, Y., & Yuwen, Z. (2021). The Hedging Policies of BP with the Systematical Analysis. Proceedings of the 2021 3rd International Conference on Economic Management and Cultural Industry (ICEMCI 2021). Atlantis Press.
International Monetary Fund. (2026). World Economic Outlook Database. Retrieved from IMF Data: https://www.imf.org/external/datamapper/NGDPD@WEO/OEMDC/ADVEC/WEOWORLD
MSCI. (2011). Global Investing: Importance of Currency Returns and Currency Hedging.
MSCI. (2012, May). Why Currency Returns and Currency Hedging Matters. MSCI Research Insight.
[1] Brinson (1986).
[2] Blake (1999) and Scott (2017).
[3] The percentage sales figure was taken from the company’s latest 10K.
[4] The percentage sales figure was taken from the company’s latest Annual Report.
[5] International Monetary Fund. (2026).
[6] London Stock Exchange Group (2024).
[7] FCA (2025)
[8] HKEX
[9] MSCI (2011)
[10] Performance period: 27.05.21–27.05.22.
[11] Performance Period 10.02.25 – 06.02.26
[12] Dimensional (2025)
[13] MSCI (2012)
Timeline Portfolios Limited is authorised and regulated by the Financial Conduct Authority (firm reference number 840807). Registered in England and Wales with Company number 11557205. Registered Office: 70 Gracechurch St, London EC3V 0HR. Timelineapp Tech Limited is registered in England and Wales with Company number 11405676. Registered Office: 70 Gracechurch St, London EC3V 0HR.
This document has been created for information purposes only and has been compiled from sources believed to be reliable. None of Timeline, its directors, officers or employees accepts liability for any loss arising from the use hereof or reliance hereon or for any act or omission by any such person, or makes any representations as to its accuracy and completeness. This document does not constitute an offer or solicitation to invest, it is not advice or a personal recommendation nor does it take into account the particular investment objectives, financial situation or needs of individual clients and it is recommended that you seek advice concerning suitability from your investment adviser.
Investors are warned that past performance is not a guide to future performance, income is not guaranteed, share prices may go up or down and you may not get back the original capital invested. The value of your investment may also rise or fall due to changes in tax rates and rates of exchange if different to the currency in which you measure your wealth. Missing periods of market exposure (time out of the market) can also have a material impact on long-term investment outcomes.