
Long-Term Risk-Return Trade-Offs for Passive Investors
For most passive investors, choosing which index to track is often seen as a straightforward decision. A common approach is to invest in a low-cost fund tracking a broad market index, such as the S&P 500 or a global benchmark, and remain invested over the long term. However, one aspect that receives less attention is how these indices are constructed, particularly the weighting methodology, which plays an important role in shaping portfolio behaviour and returns.
The most widely used approach is market-capitalisation weighting, in which each company's weight is proportional to its market value relative to the index's total market value. As a result, larger companies have a greater influence on overall index performance. This approach remains dominant within passive investing and is also the methodology used within Timeline’s portfolios.
An alternative approach is equal weighting, where each company is assigned the same allocation within the index. This reduces concentration in the largest companies and provides broader exposure across the market. However, maintaining equal weights requires periodic rebalancing, resulting in higher trading activity than market-capitalisation-weighted indices.
The distinction between these approaches has become increasingly relevant in recent years as major equity indices, particularly in the US, have become more concentrated in a relatively small number of large technology companies. This has raised broader questions around diversification, concentration risk, and the drivers of long-term returns within passive investing.
This paper explores the theoretical foundations behind market-capitalisation and equal-weighted indices, how these methodologies operate in practice, and the key differences that have historically influenced their performance characteristics.
This paper reflects Timeline’s house investment approach, which favours broad, market-capitalisation-weighted exposure as part of a diversified, long-term investment strategy.
Theoretical Foundation
The theoretical foundation behind market capitalisation weighting (market-cap) is closely linked to the Capital Asset Pricing Model and the Efficient Market Hypothesis (EMH). Under this framework, originally developed by William F. Sharpe and later expanded by other academics, the market portfolio is considered to be the optimal portfolio for investors because market prices are assumed to reflect all publicly available information.
This relationship is commonly represented through the following equation:
E(Ri) = Rf + βi[E(Rm) − Rf]
Where:
- E(Ri) = Expected return of the investment or portfolio
- Rf = Risk-free rate of return, typically represented by government bond yields
- βi = Beta of the investment, measuring its sensitivity to movements in the overall market
- E(Rm) = Expected return of the overall market portfolio
- E(Rm) − Rf = Market risk premium, representing the additional return investors expect for taking equity market risk over the risk-free rate
Under this approach, a market-capitalisation weighted index reflects the aggregate decisions of investors across the market. Companies with larger market values receive greater weights because more capital has been allocated to them by market participants. If markets are efficient, deviations from market-capitalisation weights would imply that certain securities are mispriced relative to the broader market.
Equal weighting is based on a different theoretical approach. Rather than allowing market prices alone to determine portfolio allocations, each company is assigned the same weight within the index regardless of its size. This creates a portfolio structure that differs from the broader market and results in greater exposure to smaller companies relative to a market-capitalisation weighted index.
From a theoretical perspective, equal weighting can also be viewed as a systematic contrarian approach. Because portfolios are periodically rebalanced back to equal weights, the strategy naturally trims companies whose weights have risen above target and adds to those whose weights have fallen below it.
Equal weighting is also closely linked to long-term factor research. In particular, equal-weighted indices have greater exposure to smaller companies. In the current market environment, they also tend to tilt toward value-oriented stocks. However, this is not guaranteed and depends on whether smaller companies trade at lower valuations than larger ones. Research by Eugene Fama and Kenneth French showed that company size and valuation characteristics have historically explained part of the differences in equity returns across markets over long periods.
Index Methodology
Market-Capitalisation Weighting
A market-capitalisation weighted index is constructed by assigning each company a weight based on its market-capitalisation. In simple terms, larger companies represent a larger proportion of the index, while smaller companies occupy a lower weight.
Market-capitalisation is calculated as:
Market-Capitalisation = Share Price × Number of Shares Outstanding
Most major equity indices use free float-adjusted shares, meaning only shares available for public trading are included in the calculation. Shares held by governments, founders, or strategic investors are typically excluded.
The weight of each company within the index is calculated using the following formula:
Weighti = (Pi × Qi) / Σj=1N(Pj × Qj)
Where:
- Pi = share price of company i
- Qi = number of free float-adjusted shares
- The denominator represents the total market-capitalisation of all companies within the index.
Under this approach, companies with higher market values naturally receive larger weights. For example, within the S&P 500, companies such as Apple and Microsoft hold significantly larger weights than smaller constituents because their total market values are substantially higher.
For instance, if a company represents 6% of the total market value of the index, it will also account for approximately 6% of the index weight. Similarly, a smaller company representing 0.1% of the market value will have only a 0.1% weight.
One of the key advantages of market-capitalisation weighting is that the index adjusts naturally through market movements. When a company’s share price rises, its market value increases, and its index weight rises automatically. Likewise, falling share prices reduce a company’s weight. As a result, these indices generally require relatively low levels of trading and rebalancing, helping to reduce turnover and implementation costs. This methodology also forms the foundation of many widely used passive investment strategies because it provides broad market exposure in a simple and cost-efficient manner. Indices such as the MSCI World Index and FTSE 100 follow this approach.
As discussed in the theoretical foundation section, market-capitalisation weighting is closely linked to the Capital Asset Pricing Model framework, where the market portfolio is considered efficient because it reflects the collective value and expectations of market participants.
However, market-capitalisation-weighted indices can also become concentrated in the largest companies or sectors during certain market environments. This has been particularly evident in recent years, where large US technology companies have accounted for a significant proportion of global equity index returns. As a result, the performance of market-capitalisation-weighted indices can at times be heavily influenced by a relatively small number of companies.
Equal Weighting
An equal-weighted index is constructed by assigning the same weight to each company within the index, regardless of the company’s market-capitalisation, share price, or sector exposure. In simple terms, each constituent contributes equally to the overall index performance.
The construction process begins with selecting the index universe, which consists of N securities. At the initial weighting date, or during each rebalance, every company is assigned an equal weight using the following formula:
Weighti = 1 / N
Where:
- N = total number of companies within the index.
For example, in an equal-weighted index containing 100 companies, each company would initially receive a weight of 1%.
The return of the index during a given period is calculated by combining the return of each constituent according to its equal weight:
Index Returnt = Σi=1N wi × ri,t
Where:
- wi = weight of security
- ri,t = return of security during period
As market prices change over time, constituent weights naturally drift away from equal proportions. To maintain equal weighting, the index is rebalanced at regular intervals, typically quarterly, with each constituent reset back to its target weight of 1/N.
For example, if one company’s weight rises above its target allocation following strong performance, part of the position would be reduced during the rebalance. Similarly, if another company’s weight falls below its target allocation, additional shares would be purchased to restore the original weighting.
In addition to periodic rebalancing, equal-weighted indices also undergo standard index maintenance procedures to account for corporate actions such as stock splits, dividends, mergers, spin-offs, and constituent additions or deletions. The underlying index universe is also reviewed periodically to ensure all constituents continue to meet the relevant eligibility criteria.
Equal-weighted indices often use the same constituent universe as their parent market-capitalisation weighted index, but apply an adjustment weighting mechanism to ensure each company maintains an identical allocation within the portfolio.
Sector Allocation Differences: Implications of the Weighting Methodology
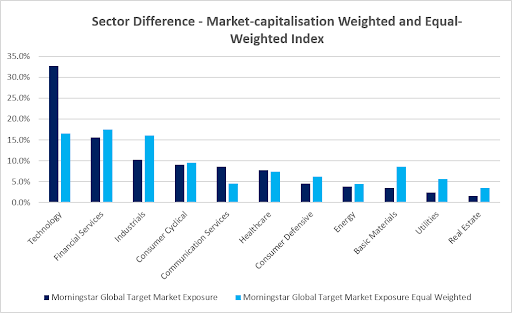
Differences in weighting methodologies can also lead to materially different sector allocations within the index, as illustrated below. The index used here is the Morningstar Global Target Market Exposure Index. This broad global benchmark captures the top 85% of free-float market-capitalisation across both developed and emerging markets. In this respect, it is similar in scope to the FTSE All-World index, providing diversified exposure to large and mid-cap companies worldwide rather than to a single national market.
Source: Morningstar Global Target Market Exposure Index and Morningstar Global Target Market Exposure equal-weighted Index (31.05.2026)
The chart highlights the sector allocation differences between the Morningstar Global Target Market Exposure Index (market-capitalisation weighted) and its equal-weighted counterpart. Under the market-capitalisation-weighted approach, sectors dominated by a relatively small number of large companies make up a significantly greater proportion of the index. This is particularly evident in Information Technology, where mega-cap technology firms account for a substantial share of the overall index weight.
As of May 2026, Information Technology represented approximately 32.7% of the market-capitalisation-weighted Morningstar Global Target Market Exposure Index, compared to around 16.6% within the equal-weighted index. By contrast, sectors such as Industrials, Financials, Materials, Utilities, and Real Estate account for materially higher weights within the equal-weighted approach; for example, Industrials rises from roughly 10.3% to 16.1% and Financials from roughly 15.6% to 17.5%.
An equal-weighted approach distributes weights evenly across constituents, reducing the influence of the largest companies. The result is a broader distribution of exposure across sectors. This creates a portfolio structure that is less dependent on the performance of a relatively small number of companies.
The chart also illustrates how weighting methodology can influence the underlying drivers of index performance. Market-capitalisation-weighted indices naturally concentrate exposure in sectors dominated by the largest growth companies, reflecting the outsized market values of their constituent firms, while equal-weighted indices provide broader exposure across sectors and company sizes.
These allocation differences help explain why market-capitalisation-weighted and equal-weighted indices can behave differently across market environments, despite often containing the same underlying companies.
Index Performance
The long-run record
Historically, both market-capitalisation-weighted and equal-weighted indices have delivered strong long-term equity returns, although return patterns have varied across different market environments.
Source: Morningstar 2026. Global TME Equal: Morningstar Global Target Market Exposure Equal Weighted PR GBP and Global TME: Morningstar Global Target Market Exposure PR GBP.
Past performance is not a reliable indicator of future results.
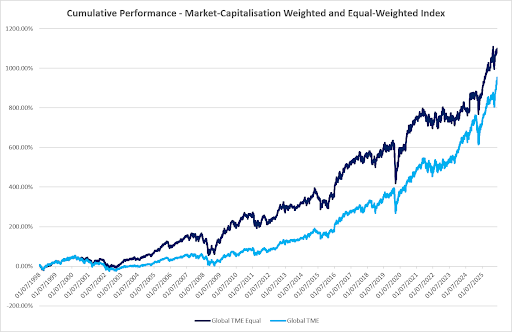
The chart above compares a traditional market-capitalisation-weighted global equity index with an equal-weighted version over the period from the end of 1998 to mid-2026. Both approaches delivered strong long-term returns, although the path to achieving those returns differed.
Over the full period, the equal-weighted approach generated the higher cumulative return. By allocating the same weight to each company, the strategy benefited from a broader set of return drivers across the market rather than relying heavily on the largest stocks. This increased exposure to smaller and medium-sized companies contributed positively to long-term returns.
However, the higher return was accompanied by greater volatility. The equal-weighted index experienced larger drawdowns during periods of market stress and a less consistent return path. Smaller companies have historically been more sensitive to economic conditions and changes in investor sentiment, which can lead to larger short-term fluctuations.
The market-capitalisation weighted approach delivered slightly lower cumulative returns over the period but generally experienced smaller drawdowns. As larger companies account for a greater share of the index, performance has been increasingly influenced by a relatively small number of dominant businesses, particularly in recent years, where mega-cap technology stocks have driven market returns.
Performance leadership shifted over time. The equal-weighted approach tended to perform well when returns were broadly distributed across the market, while market-capitalisation-weighted indices generally benefited when gains were concentrated among a smaller group of larger companies.
This comparison highlights an important trade-off for investors. Equal weighting has historically delivered stronger returns, but the graph above clearly shows that those returns came with higher volatility and deeper temporary declines. Market-capitalisation weighting provided a smoother investment journey, albeit with greater reliance on the performance of the market's largest companies.
This record underlines that neither methodology is consistently superior; outcomes depend on market leadership and the breadth of returns across sectors and company sizes.
Recent Market Concentration
In recent years, market-capitalisation-weighted indices have become increasingly concentrated in a small number of large US technology companies. This trend accelerated following the pandemic and strengthened further during the artificial intelligence-driven (AI) rally from 2023 onwards.
As market-capitalisation-weighted indices allocate more weight to companies as their share prices and market values rise, the strong performance of mega-cap technology companies led to a growing concentration within major indices such as the S&P 500 and MSCI World Index. Companies including Apple, Microsoft, NVIDIA, Amazon, Meta Platforms and Alphabet became dominant contributors to overall index returns.
The trend was further supported by growing investor enthusiasm for artificial intelligence-related investments, alongside strong earnings growth expectations for large technology companies. Equity market leadership became increasingly concentrated among firms with significant exposure to AI infrastructure, semiconductors, cloud computing, and digital platforms, while broader market participation remained comparatively weaker. The growing divergence between AI-related and non-AI-related companies further reinforced market concentration, as investor capital and earnings expectations became increasingly focused on a relatively small number of mega-cap technology firms. Expectations for continued large-scale investment in AI infrastructure also supported this trend, with AI-related spending projected to contribute significantly to future S&P 500 earnings growth (Forecasts are not guaranteed and may not be realised).
This environment significantly benefited market-capitalisation-weighted indices after 2020. Because market-cap-weighted indices automatically increase exposure to companies as they grow larger, investors participated more fully in the strong performance of mega-cap technology companies without requiring active rebalancing. Equal-weighted indices, by contrast, maintained fixed allocations across constituents and therefore had lower exposure to the largest technology stocks during this period.
As a result, market leadership became increasingly narrow, with a small number of mega-cap technology companies accounting for a significant share of overall US equity market returns during the post-pandemic period. While this supported strong index performance, it also increased concentration risk and dependence on a limited number of companies and sectors. Although market-capitalisation weighting remains an efficient and low-cost approach to passive investing, recent years have highlighted the trade-off between market efficiency and diversification when returns become heavily concentrated in a small group of dominant companies.
Timeline's approach
Timeline recognises that elevated market concentration has become a feature of global equity markets, particularly in the US technology sector. However, we view concentration as a recurring feature of evolving markets rather than a structural weakness within passive investing. We believe successful and innovative companies naturally become a larger part of market indices over time.
Market-capitalisation-weighted indices contain a built-in self-correcting mechanism through market rotation. As companies grow and increase in value, their weights naturally rise within the index, while weaker or less competitive firms gradually decline in importance. This allows passive investors to participate in long-term economic progress without needing to predict future winners and losers.
Also, similar periods of concentration have occurred historically, including during the dot-com era, when companies such as Cisco, Intel, and General Electric dominated markets before leadership eventually rotated towards firms such as Apple, Amazon, Alphabet, and Nvidia.
As a result, while concentration can increase short-term volatility and narrow market leadership, Timeline believes that predicting when leadership will change is extremely difficult. Therefore, we continue to favour a market-capitalisation-weighted investing approach, supported by the view that markets adapt over time through innovation, competition, and economic evolution.
Practical Implications and Trade-Offs
Rebalancing
Market-Capitalisation Weighted Indices
Market-capitalisation-weighted indices require relatively little active rebalancing. As company share prices rise or fall, their weights within the index adjust automatically. Companies that perform well naturally become a larger part of the index, while weaker-performing companies see their weight decline accordingly. This self-adjusting mechanism allows market-cap-weighted indices to maintain very low turnover, with trading activity generally limited to index reconstitutions, corporate actions, and free-float adjustments.
The low-turnover structure is one of the main reasons that market-capitalisation-weighted investing became the dominant approach within passive investing. Lower trading activity typically results in lower transaction costs, reduced market impact, improved tax efficiency, and greater scalability for large pools of capital. In addition, market-cap-weighted indices naturally increase exposure to companies experiencing strong earnings growth and positive market momentum.
However, as noted earlier, this approach can also lead to increasing concentration during periods when a small number of companies dominate market returns. As a result, market-cap-weighted indices can become increasingly dependent on continued strength from a relatively small number of dominant companies.
Equal-Weighted Indices
Equal-weighted indices follow a fundamentally different approach. Rather than allowing weights to drift with market performance, equal-weighted indices periodically rebalance constituents back to equal allocations. This means positions that have risen strongly are systematically reduced, while weaker-performing positions are increased. In effect, the strategy follows a disciplined “buy low, sell high” process through regular rebalancing.
Over long periods, this rebalancing mechanism can itself become a source of return, particularly during volatile or mean-reverting market environments. By continuously trimming outperforming stocks and reallocating towards relatively weaker areas of the market, equal-weighted indices may capture what is often referred to as a “rebalancing premium” or “volatility harvesting” effect. This has historically supported periods of outperformance during broader market recoveries and environments where returns were more evenly distributed across sectors and company sizes.
At the same time, the higher level of trading required to maintain equal allocations results in materially higher turnover compared to market-cap-weighted indices. This can increase transaction costs, market impact, and operational complexity, particularly in less liquid segments of the market. Equal-weighted indices also tend to maintain greater exposure to smaller companies and value-oriented stocks, which can increase volatility and lead to periods of underperformance when market leadership becomes concentrated among large growth companies.
The post-2020 market environment highlighted these differences clearly. Market-cap-weighted indices benefited significantly from the strong performance of mega-cap technology companies, as rising share prices automatically increased their weights within the index. equal-weighted indices, by contrast, continuously trimmed exposure to these outperforming companies during rebalancing periods, resulting in lower participation in the concentrated technology rally.
Comparing the Rebalancing Effects
The difference in rebalancing methodology reflects two distinct approaches to passive investing. Market-capitalisation weighting prioritises efficiency, low turnover, and market representation, while equal weighting prioritises diversification and systematic rebalancing.
Market-cap-weighted indices tend to perform particularly well during momentum-driven markets where returns are concentrated among a small number of large companies. Equal-weighted indices, by contrast, have historically performed better during periods when market leadership broadens across sectors and company sizes.
Neither approach is consistently superior across all market environments. The relative performance of each methodology largely depends on whether market returns remain concentrated among dominant companies or become more broadly distributed across the wider market over time.
Tax Efficiency
Tax efficiency is another area where market-capitalisation-weighted and equal-weighted indices can differ, particularly for investors holding portfolios outside tax-sheltered accounts.
Market-capitalisation-weighted indices are generally considered more tax-efficient because they require relatively little rebalancing. As constituent weights adjust naturally through market price movements, there is typically less need for frequent trading within the portfolio. Lower turnover can help reduce realised capital gains and transaction-related tax impacts over time.
Equal-weighted indices, by contrast, require periodic rebalancing to maintain equal allocations across constituents. This involves trimming outperforming positions and increasing exposure to weaker-performing holdings, resulting in higher portfolio turnover. Over time, this additional trading activity may lead to higher realised capital gains relative to market-capitalisation-weighted strategies.
In practice, however, the significance of these differences will depend heavily on the investment structure and account type used by the investor. For portfolios held within pensions, Individual Savings Accounts, or other non-taxable wrappers in the Model Portfolio Services (MPS), the practical impact of tax-efficiency differences may be less material than in directly taxable portfolios.
Overall, market-capitalisation-weighted indices tend to provide greater structural tax efficiency due to their lower trading requirements, while equal-weighted indices trade some of this efficiency in exchange for broader diversification and systematic rebalancing exposure.
Volatility
Volatility is another important distinction between market-capitalisation-weighted and equal-weighted indices. Although both approaches invest in the same underlying market, differences in weighting methodology can result in different risk characteristics over time.
Market-capitalisation-weighted indices have generally exhibited lower volatility during periods when large companies dominate market returns. Larger companies are often more established, have stronger balance sheets, and typically experience lower share price volatility relative to smaller companies. As these firms represent a larger share of the index, they can help dampen overall portfolio volatility during certain market environments.
This was particularly evident in the post-2020 period, when a small number of large US technology companies drove a disproportionate share of global equity returns. The strong performance of mega-cap technology firms contributed to relatively strong risk-adjusted returns for market-capitalisation-weighted indices, though it also resulted in a meaningful increase in market concentration.
Equal-weighted indices, by contrast, tend to exhibit higher volatility over time. Because all constituents receive the same allocation regardless of company size, equal-weighted strategies naturally maintain greater exposure to smaller and more cyclical companies. These companies are typically more sensitive to economic conditions, interest rates, and changes in investor sentiment, which can lead to larger price fluctuations.
The periodic rebalancing process within equal-weighted indices can also contribute to short-term volatility. During concentrated market rallies, equal-weighted indices systematically trim exposure to strongly outperforming stocks and reallocate capital towards weaker-performing companies. While this disciplined rebalancing approach may support diversification and long-term return potential, it can lead to periods of underperformance relative to market-capitalisation-weighted indices when market leadership remains narrow.
However, higher volatility does not necessarily result in weaker long-term outcomes. Historically, equal-weighted indices have at times delivered stronger long-term returns during periods when market performance broadened across sectors and company sizes. Broader diversification across constituents may also reduce dependence on a small number of dominant companies over time. At the same time, greater exposure to smaller and more cyclical companies means that risk-adjusted returns can vary significantly across different macroeconomic environments.
Liquidity and Capacity
Liquidity and portfolio capacity are important practical considerations when comparing market-capitalisation-weighted and equal-weighted indices, particularly for larger portfolios and institutional investors.
Market-capitalisation-weighted indices generally allocate a greater proportion of assets towards the largest and most liquid companies in the market. These companies typically have higher trading volumes, narrower bid-ask spreads, and greater market depth, allowing large amounts of capital to be traded with relatively limited market impact. As a result, market-capitalisation weighted strategies are generally easier and cheaper to implement at scale. Their lower turnover requirements further support liquidity efficiency by reducing the amount of trading required over time.
Equal-weighted indices, by contrast, naturally allocate a larger proportion of the portfolio towards smaller and medium-sized companies relative to market-capitalisation-weighted indices. While this can improve diversification and broaden market exposure, it also introduces additional liquidity considerations. Because equal-weighted indices allocate relatively more towards smaller companies, liquidity and trading costs can become more important considerations during periods of market stress or weaker market conditions.
The periodic rebalancing process within equal-weighted indices can further increase trading requirements. Equal-weighted strategies generally experience materially higher turnover than market-capitalisation-weighted indices, as constituents are regularly reset back to equal allocations. This can increase transaction costs and market impact, particularly for larger investment vehicles attempting to trade less liquid securities. The quarterly rebalance structure used within many equal-weighted indices, including the S&P 500 Equal Weight Index, contributes to these higher trading requirements.
Capacity can also become a more important consideration for institutional investors managing large pools of assets. Market-capitalisation weighted indices are generally considered highly scalable because capital is naturally concentrated in the largest companies, where trading capacity is significantly deeper. Equal-weighted strategies may face greater implementation constraints as assets under management grow, since larger allocations to smaller companies can make trading more difficult without influencing market prices.
In practice, these differences mean that market-capitalisation-weighted indices tend to offer stronger liquidity characteristics, lower implementation frictions, and greater scalability, while equal-weighted indices trade some of these advantages in exchange for broader diversification and reduced concentration in the largest companies.
Conclusion
Ultimately, the comparison between market-capitalisation-weighted and equal-weighted indices demonstrates that different weighting methodologies can produce different outcomes over time, even when investing in a broadly similar universe of companies. The relative performance of each approach will depend on the market environment and the breadth of returns across companies, sectors and regions. Rather than seeking a consistently superior methodology, investors should focus on selecting an approach that aligns with their investment objectives and can be sustained across different market cycles.
From Timeline’s perspective, market-capitalisation-weighted investing remains the preferred approach due to its low-cost structure, scalability, liquidity, implementation efficiency, and alignment with an evidence-based investment philosophy. While periods of concentration can increase dependence on a smaller number of companies, market-capitalisation-weighted indices naturally evolve as market values change, allowing investors to participate in the growth of successful businesses while maintaining broad market exposure. While equal weighting offers broader diversification and a potential rebalancing premium, these benefits come with meaningfully higher turnover, greater short-term volatility, and structural disadvantages during sustained periods of large-cap dominance, trade-offs that are particularly relevant for cost-conscious, long-term passive investors.
As a result, Timeline’s approach remains focused on broad global diversification and a disciplined long-term investment strategy, rather than making tactical adjustments based upon changing market leadership or short-term market trends.
References
- Sharpe, W.F. (1964) ‘Capital asset prices: A theory of market equilibrium under conditions of risk’, The Journal of Finance, 19(3), pp. 425–442. Available at: https://www.jstor.org/stable/2977928.
- Fama, E.F. and French, K.R. (1993) ‘Common risk factors in the returns on stocks and bonds’, Journal of Financial Economics, 33(1), pp. 3–56. Available at: https://terpconnect.umd.edu/~wermers/ftpsite/FAME/Fama_French_%281993%29.pdf.
- MSCI (2025) MSCI Index Calculation Methodology. February 2025. Available at: https://app2.msci.com/eqb/methodology/meth_docs/MSCI_Index_Calculation_Methodology_Feb2025.pdf.
- S&P Dow Jones Indices (n.d.) Index Mathematics Methodology. Available at: https://www.spglobal.com/spdji/en/methodology/article/index-mathematics-methodology/.
- Financial Times (2026) ‘Wall Street rebound driven by smallest number of stocks on record’. Available at: https://www.ft.com/content/7599af3b-2184-4538-8ef9-370e01c1aaa8.
- S&P Dow Jones Indices (n.d.) S&P U.S. Indices Methodology. Available at: https://www.spglobal.com/spdji/en/methodology/article/sp-us-indices-methodology/.
- MSCI (2021) MSCI Equal Weighted Indexes Methodology. May 2021. Available at: https://www.msci.com/eqb/methodology/meth_docs/MSCI_Equal_Weighted_Indexes_Methodology_May2021.pdf.
- MSCI (2025) Corporate Events Methodology. November 2025. Available at: https://app2.msci.com/eqb/methodology/meth_docs/MSCI_CEMethodology_Nov2025.pdf.
- Morningstar (2026) Morningstar Global Target Market Exposure Equal Weighted PR GBP and Morningstar Global Target Market Exposure PR GBP [index data].
- S&P Dow Jones Indices (2018) Outperformance in Equal Weight Indices. Available at: https://www.spglobal.com/spdji/en/documents/research/research-outperformance-in-equal-weight-indices.pdf.
- Goldman Sachs (2026) ‘US stocks are forecast to rise 6% in 2026’, 29th April. Available at: https://www.goldmansachs.com/insights/articles/us-stocks-forecast-to-rise-in-2026.
- MSCI (2025) MSCI Index Calculation Methodology. August 2025. Available at: https://www.msci.com/eqb/methodology/meth_docs/MSCI_Index_Calculation_Methodology_Aug2025.pdf.
- Bender, J. (2012) Demystifying Equal Weighting. MSCI, 6th July. Available at: https://www.msci.com/research-and-insights/paper/demystifying-equal-weighting.
- Rabener, N. (2021) ‘Equal- vs. market cap-weighted portfolios in stock market crashes’, CFA Institute Enterprising Investor, 10th September. Available at: https://rpc.cfainstitute.org/blogs/enterprising-investor/2021/equal-vs-market-cap-weighted-portfolios-in-stock-market-crashes.
- Northern Trust Asset Management (n.d.) Hidden Risk of Equal Weighting: Equal Weighting: The (Limited) Benefits and the (Substantial) Risks. Available at: https://ntam.northerntrust.com/content/dam/northerntrust/investment-management/global/en/documents/research/quantitative/equal-weight.pdf.
- S&P Dow Jones Indices (n.d.) S&P U.S. Indices Methodology. Available at: https://www.spglobal.com/spdji/en/methodology/article/sp-us-indices-methodology/.
Important information
This blog is prepared exclusively for use by financial advisers; retail distribution is at the adviser's sole risk and discretion. It does not constitute advice, an offer or a solicitation to invest.
Compiled from sources believed to be reliable. Any views, opinions or estimates expressed, including any forecasts or forward-looking statements, constitute the author’s judgment at the time of writing, are not guaranteed and are subject to change without notice. None of Timeline, its directors, officers or employees accepts liability for any loss arising from the use hereof or reliance hereon or for any act or omission by any such person, or makes any representations as to its accuracy and completeness.
Past performance is not a reliable indicator of future results. Income is not guaranteed, share prices may go up or down and you may not get back the original capital invested. The value of your investment may also rise or fall due to changes in tax rates and rates of exchange if different to the currency in which you measure your wealth. Missing periods of market exposure (time out of the market) can also have a material impact on long-term investment outcomes.


.png)