For the past few years, it has been hard to talk about US markets without talking about the much-loved nickname, the ‘Magnificent Seven’. The term refers to seven of the largest and most influential US-listed companies, Nvidia, Apple, Microsoft, Alphabet, Amazon, Meta and Tesla. Their stocks have dominated both returns and headlines since the term was coined in May 2023 by Bank of America strategist Michael Hartnett, in a nod to the 1960 Western of the same name.
By mid-2026, those seven companies alone accounted for around 34% of the S&P 500, up from 21.6% in 2022 and just 12.4% in 2015. But market leadership has never stood still for very long, and that is worth paying attention to.
The Mag 7 itself is not really a new phenomenon. Investment professionals loved a good group label long before the Mag 7 were a thing. In the late 1990s, attention centred on the “Four Horsemen” of the dotcom boom, Cisco, Dell, Intel and Microsoft. In 2013, Jim Cramer and Bob Lang coined FANG for Facebook, Amazon, Netflix and Google, which later became FAANG with the addition of Apple. A decade later came the Mag 7.
Market leadership changes
Of the five largest technology companies at the March 2000 peak, only Microsoft has made it into today’s grouping.
The turnover underneath those labels is more striking than the names themselves. Of the five largest technology companies at the March 2000 peak, Microsoft at $561bn, Cisco at $555bn, Intel at $509bn, Oracle at $245bn and IBM at $215bn, only Microsoft has made it into today’s grouping.
The lesson is not that dominant technology companies inevitably disappoint. It is that market leadership is far more fluid than it can appear at the time. We are seeing that process play out again today.
Over the past three years, market leadership has moved almost as fast as AI itself. The original Mag 7 has recently been outpaced by companies supporting the physical infrastructure behind AI, with the group underperforming the broader market over the last quarter.
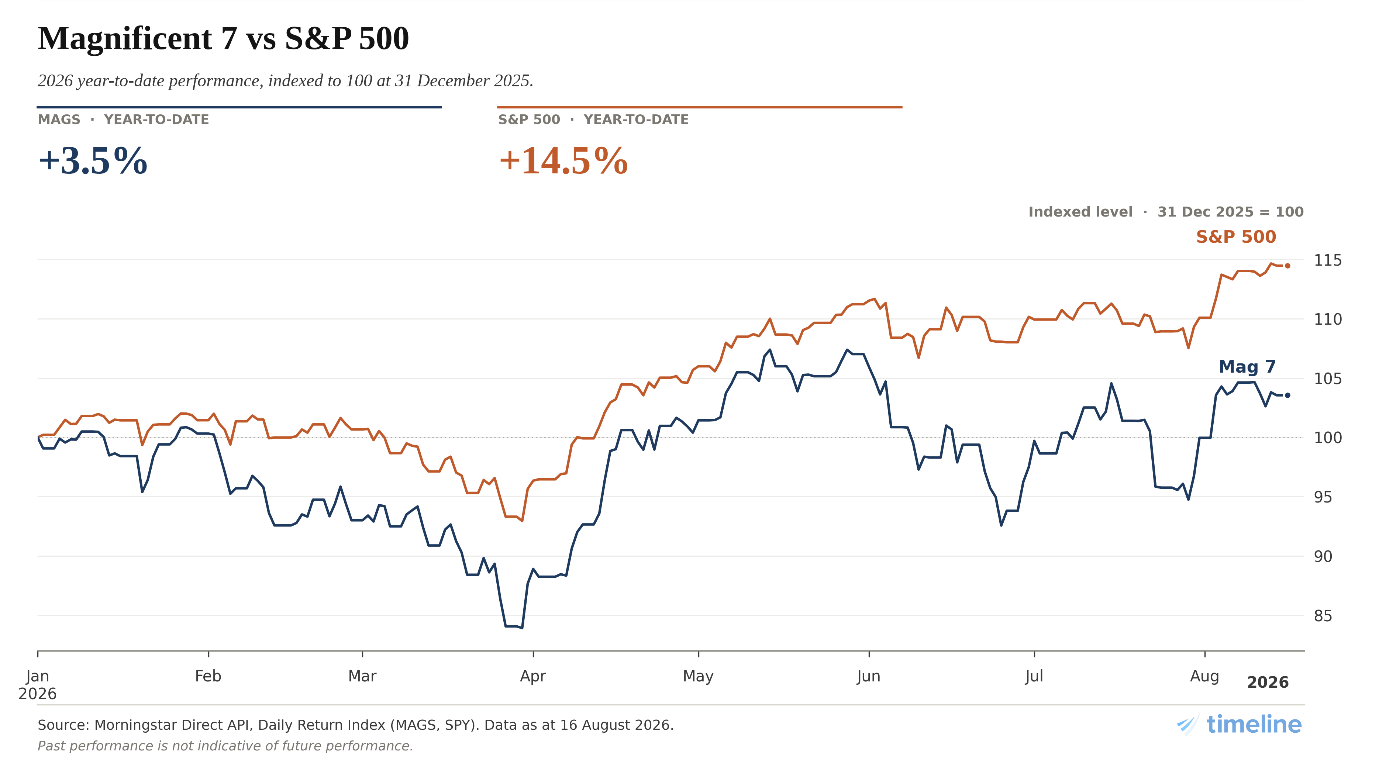
Source: Morningstar Direct API, Daily Return Index (MAGS and SPY), *data as of 16th August 2026.
Past performance is not indicative of future performance.
Partly a victim of its own success, years of market dominance have pushed Mag 7 valuations higher, raising the bar for these companies to keep surprising investors and driving share prices higher.
At the same time, the huge sums being spent on AI are flowing into the companies building the infrastructure behind it, from chipmakers and data centres to energy utilities. This is broadening the opportunity beyond the original Mag 7 and helping new market leaders emerge.
However, this does not mean the Mag 7 story is over. Following uncertainty around Asian memory-chip makers in July, momentum flipped sharply. The Mag 7 added $1.5tn in market value that month, while semiconductor stocks outside Nvidia lost around $1.7tn.
Rather than a clean rotation away from the Mag 7, this looks more like a broadening of market leadership. We expect the group to remain an important part of the technology story alongside chipmakers such as Broadcom, AMD and Micron. Bank of America has grouped these wider beneficiaries under the “AI Big 10” label. Together, they now account for roughly 28% of the S&P 500, up from around 14% when ChatGPT launched in late 2022.
AI Big 10
Bank of America has grouped wider AI beneficiaries under the “AI Big 10” label. Together, they now account for roughly 28% of the S&P 500, up from around 14% when ChatGPT launched in late 2022.
While tech companies may be getting the most attention, they are not the only part of the market seeing rotation. Recent geopolitical tensions, particularly around the Middle East, have turbocharged energy returns, while US healthcare, partly due to a reduction in policy risk and partly due to AI efficiencies, has seen market-beating performance after years of near-flat returns.
It is also worth remembering that this is not just a US story. TSMC, the Taiwanese chip manufacturing giant, is one example of strong performance outside the US, while similar broadening has been visible across healthcare, energy and other sectors. The rotation is wider than just the biggest AI names.
Portfolio construction
How portfolios adjust as market leadership changes
It is reasonable to wonder whether all this movement at the top of the market creates more risk for your portfolio. So far this year, from a drawdown perspective, that has not been the case. The S&P 500 has experienced a maximum drawdown of around 7% year to date, compared with a 46-year average of 14.2%.
One reason portfolios can absorb changes in market leadership is the way market-cap weighted investing works. Most major indices, and every Timeline model, start from this approach. Put simply, larger companies make up a larger share of the portfolio, while smaller companies make up less.
The important part is that these weights naturally change as markets move. If a market leader falls in value, its weight in the portfolio falls with it. If another company grows in value, its weight rises. The portfolio therefore adapts as leadership changes, without needing to predict in advance which company or sector will be the next winner.
Concentration risk in perspective
A common concern with market-cap weighted investing is concentration. When a relatively small number of large companies make up a bigger share of the market, their fortunes can have a greater influence on overall returns.
That concern is reasonable, but periods of concentrated market leadership are not unusual. As the chart shows, different sectors have led the US market at different points in time. What stands out today is how strong and prolonged technology’s period of leadership has been.
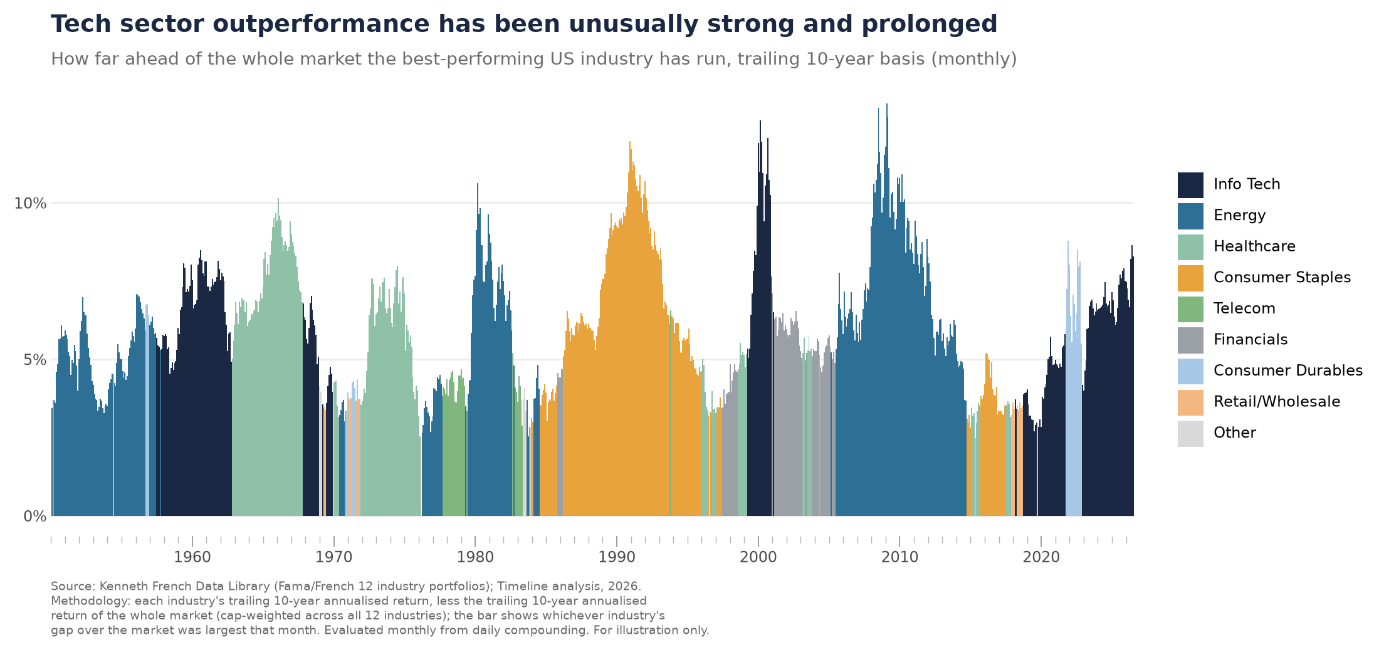
Source: Kenneth French Data Library; Timeline analysis, 2026.
There is also an important difference between today and the dot-com era. Many of today’s largest technology companies combine high valuations with substantial earnings and cash flows. That does not remove concentration risk, but it does mean the foundations of today’s market leadership look different from those seen around the peak of the dot-com bubble.
Trying to avoid concentration altogether can create risks of its own.
Deliberately underweighting the largest parts of the market, such as US equities, means making an active call that those companies or markets will underperform. Research suggests those calls are difficult to get right consistently and can ultimately increase portfolio risk or reduce returns.
Conclusion
Markets change. The investment approach does not need to.
Whatever label comes next, whether it is the Mag 7, the AI Big 10, MANGOS or something else entirely, market leadership will keep changing. That is not something investors need to predict or chase.
Timeline’s portfolios are designed to adjust as the market changes, allowing new winners to become a larger part of the portfolio while yesterday’s leaders naturally become less important. The headlines may change quickly, but the investment approach does not need to.
References
- Brock, C. (2026) ‘S&P 500’s weight in Mag 7 stocks passes 30%. Is this a diversification risk?’, Forbes, 8th July. Available at: https://www.forbes.com/sites/investor-hub/article/sp-500-weight-mag-7-stocks-diversification-risk/ .
- Visual Capitalist (2022) The largest public companies by market cap, 2000–2022. 17th October. Available at: https://www.visualcapitalist.com/cp/largest-companies-from-2000-to-2022/ .
- Blikre, J. (2026) ‘$3.2 trillion rotation from chips to the “Magnificent 7” has left the S&P 500 going nowhere’, Yahoo Finance, 16th July. Available at: https://finance.yahoo.com/markets/article/32-trillion-rotation-from-chips-to-the-magnificent-7-has-left-the-sp-500-going-nowhere-chart-of-the-day-100000821.html .
- Bank of America (2026) The AI Big 10 now comprises 28% of the S&P 500, up from 14% in 2023. Cited in The Kobeissi Letter.
- VanEck (2026) The state of US sector investing in mid-2026. 29th July. Available at: https://www.vaneck.com/us/en/blogs/thematic-investing/the-state-of-us-sector-investing-in-mid-2026/ .
- J.P. Morgan Asset Management (2026) What’s happening to stocks beneath the index? 27th March. Available at: https://am.jpmorgan.com/us/en/asset-management/liq/insights/market-insights/market-updates/on-the-minds-of-investors/whats-happening-to-stocks-beneath-the-index/ .
- French, K.R. (2025) Kenneth R. French Data Library. Dartmouth College. Available at: https://mba.tuck.dartmouth.edu/pages/faculty/ken.french/data_library.html .
- Kritzman, M. and Turkington, D. (2025) ‘The fallacy of concentration’, State Street, 14th October. Available at: https://www.statestreet.com/gb/en/insights/fallacy-of-concentration .