.png)
For Financial Advisers Only
Every adviser has had the call. Markets are falling, and a client wants out. This paper shows what that instinct costs. We test it three ways: by removing the market’s best days, then its best months, then by modelling real panic selling across 973 historical retirements. The findings are consistent. Over the long term, historical data shows us that time in the market can be more effective than trying to time the market.
What does missing a handful of days actually cost?
The chart below tells the simplest version of the story. We invest £100,000 in a 100% global equity portfolio on 23rd June 2008 and hold it for sixteen years. That window covers the Global Financial Crisis, the Eurozone debt crisis, the COVID crash, and the inflation shock that followed. Fully invested, the portfolio ends at £528,124, more than five times its starting value.
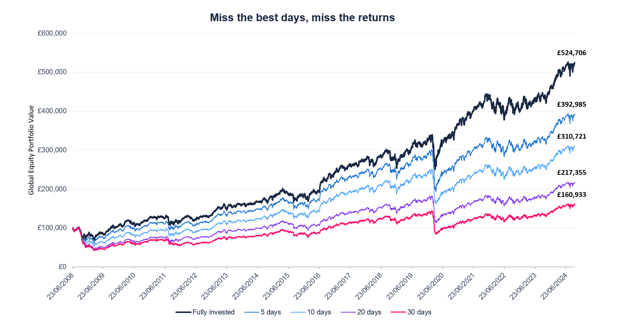
© Timeline Holdings Ltd 2026. Source: Timeline using data from Morningstar (provided without liability). £100,000 is invested in a 100% global equity portfolio for the period 23/06/2008 - 03/10/2024. To calculate we rank returns from worst to best and skip the best 5, 10, 20 and 30 days. Global Equities: Morningstar Global All Cap Target Market Exposure Index.
This chart is illustrative only and does not consider the impact of fees, transaction costs and taxes - all of which reduce returns. Past performance is not a reliable indicator of future results.
Out of roughly 4,200 trading days, missing only the five best days drops the final balance to £395,545, a £132,579 loss. Miss the best thirty, and the portfolio ends at £161,981. The chart looks like a fan. The message is arithmetic: a tiny minority of trading days does most of the heavy lifting. Lose them, and you could lose nearly everything compounding had on offer.
The same lesson, with deeper history and real withdrawals
First, we extended the historical window. We use monthly returns from January 1915 to December 2025, covering 1,332 months and spanning two World Wars, hyperinflation, the Great Depression, six recessions, and more. From that data, we generated 973 rolling thirty-year scenarios, each starting in a different month from 1915 through 1996.
Second, we built the question into a financial-planning framework. Each retiree begins with £100,000 in a 100% global equity portfolio and withdraws £4,000 in year one. That’s the textbook 4% rule: take 4% of the starting pot, then increase it with inflation each year. For inflation adjustment we have made no assumptions. Instead for each historical scenario we use the values of CPI for the same period. The portfolio rebalances annually. The horizon is thirty years.
For each of those 973 rolling periods, we then asked the same question as the first chart, scaled up: what happens to the average portfolio balance if you miss the best months in each scenario? The chart below averages the results across all 973 retirements.
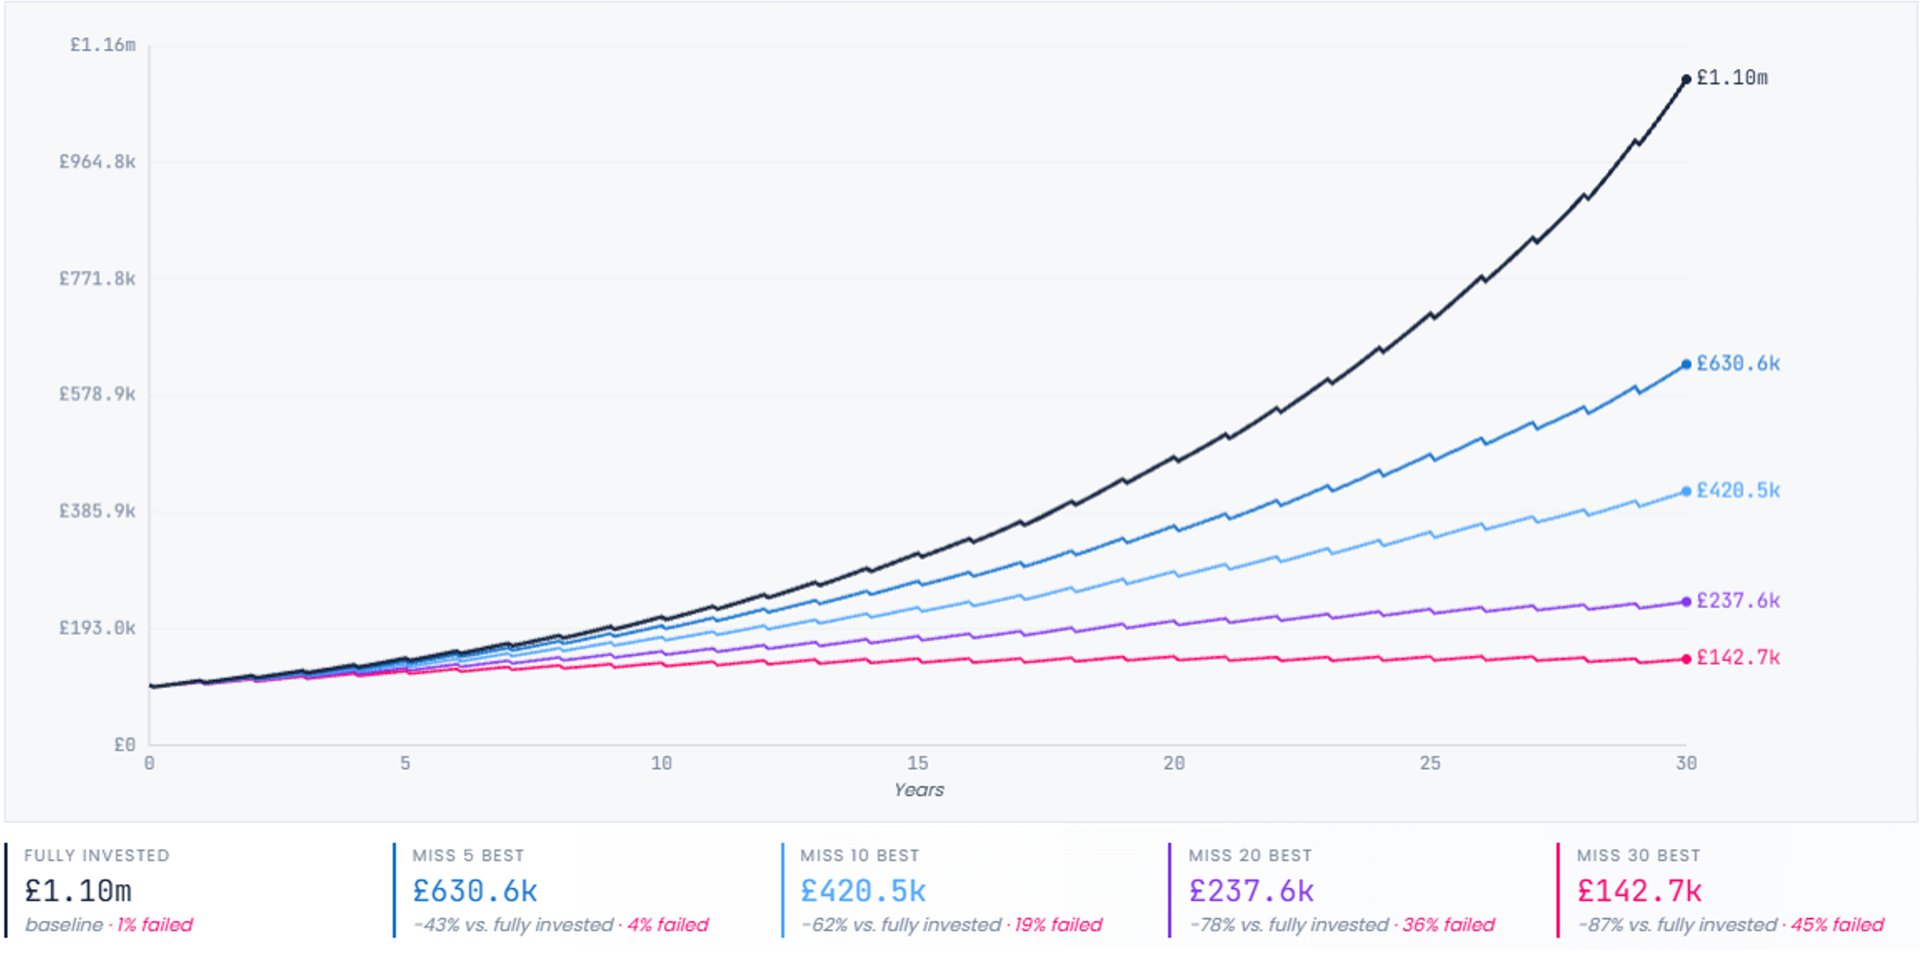
© Timeline Holdings Ltd 2026. Source: Timeline using data from Morningstar (provided without liability). Global Equities: Morningstar Global All Cap Target Market Exposure Index.
Past performance is not a reliable indicator of future results.
Fully invested, the average retirement scenario ends with £1.10m of legacy, the estate left to heirs, after thirty years of inflation-adjusted withdrawals. Miss the five best months across each retirement scenario, and the average legacy falls to £630,600, a 43% reduction. Miss the thirty best months and the average legacy collapses to £142,700, an 87% reduction. In that case, 45% of retirement scenarios modelled fail outright; in other words, they run out of money.
Removing the best months is a useful illustration, but it isn't what happens in practice. Nobody wakes up on a Monday morning and decides to miss the next ten days. What people actually do is sell after a sharp fall. By the time they have the conviction to buy back in, the recovery may have already started. The way investors miss the best months is, almost always, panic selling.
We can model that behaviour directly, using two rules. The panic-sell rule: if the portfolio falls more than 10% over the previous 12 months, sell everything into cash. The re-invest rule does the reverse: if the trailing 12-month return rises above 10%, move the cash back into the market at target weights.
We check both rules once at the beginning of each year, and both can fire more than once during a retirement. The rules follow no judgment, only the numbers. That mirrors how a nervous investor tends to act: out after a bad year, back in once things visibly recover.
So, across 973 historical retirements, does the rule help or hurt?
One scenario where panic selling looks brilliant
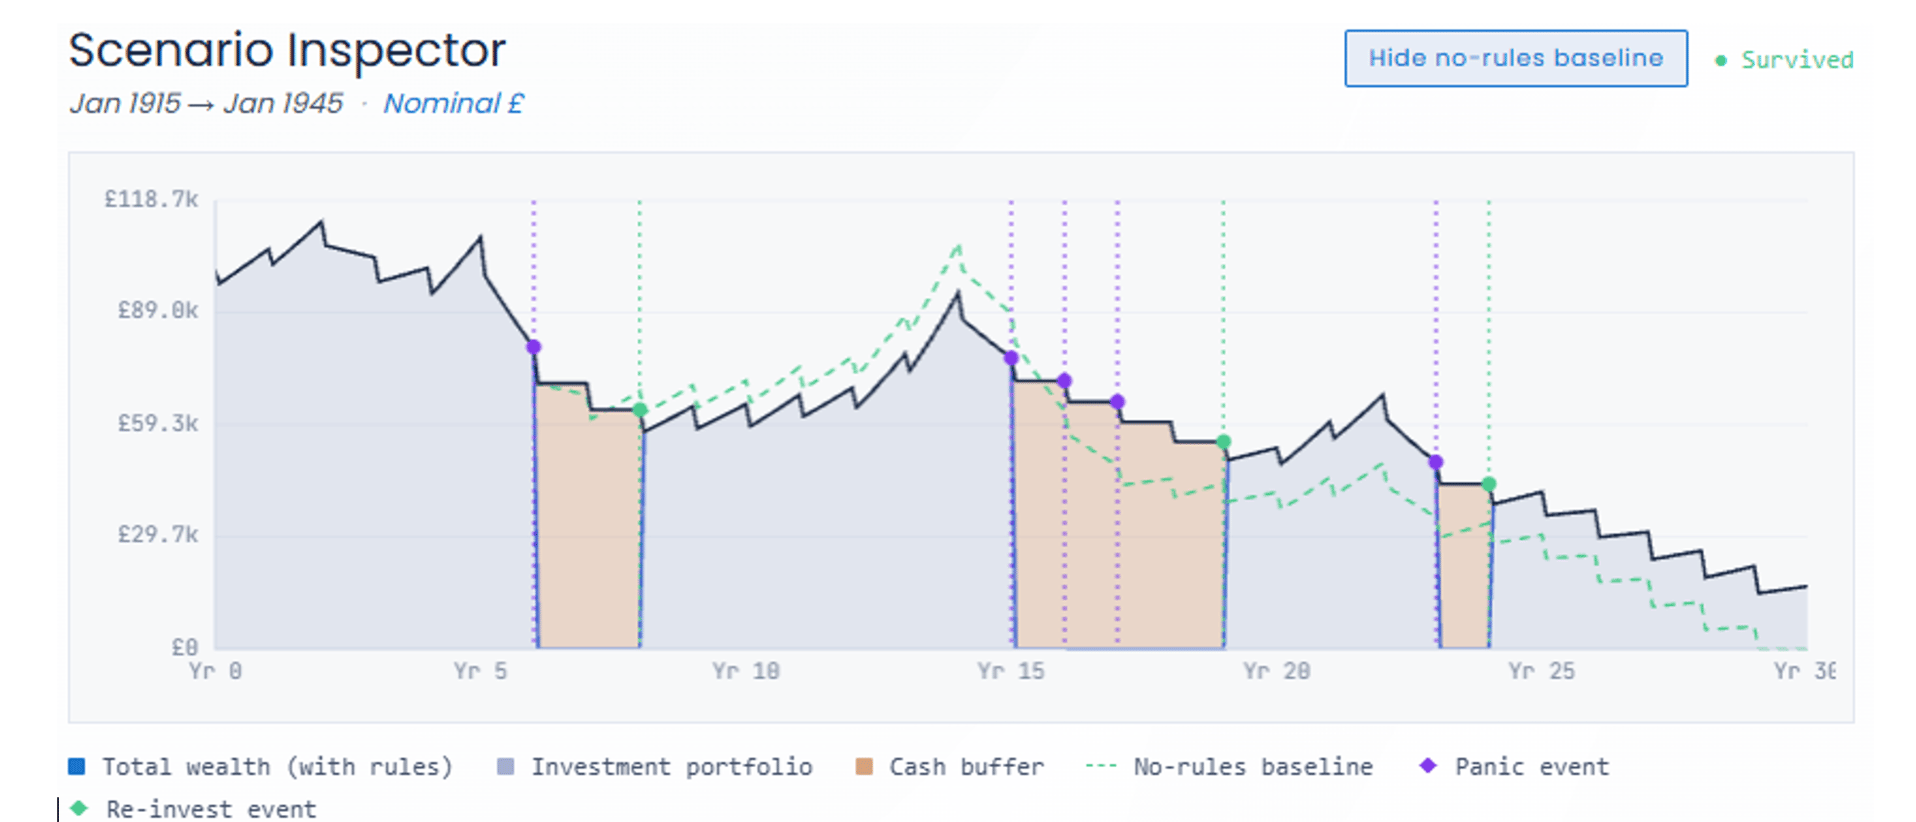
Take the first retirement in the dataset, a thirty-year arc beginning in January 1915. The chart below shows the same scenario simulated twice. Rules on is the solid navy line, with shaded cash buffers and dotted event markers. Rules off is the dashed green line.
© Timeline Holdings Ltd 2026. Source: Timeline using data from Morningstar (provided without liability). Global Equities: Morningstar Global All Cap Target Market Exposure Index.
Past performance is not a reliable indicator of future results.
The retiree began with £100,000 and withdrew £4,000 inflation-adjusted each year. They lived through the post-war deflation, the 1929 crash, the 1937 recession and World War II.
The -10% threshold was breached on five occasions. Three times, the entire portfolio was moved to 100% cash. On the other two occasions, the portfolio was already fully in cash, so a further market fall triggered no new sale. Each sale to cash took money out before the drawdown deepened, and it went back into the market once the rebound was underway. The solid line ends meaningfully above the dashed one. In this retirement scenario, panic selling worked in the retiree's favour.
If this were the only chart someone showed you, the case for selling in a storm would feel airtight. The cash buffer rescued real money. The rule looks not just defensible but clever.
This is exactly the kind of evidence that makes bad financial rules of thumb spread: a single, well-chosen case.
But across 973 retirements, it doesn’t
The same parameters, evaluated across the full 1915-2025 sample, tell the opposite story.
Switch the panic-sell and re-invest rules off, and the retiree stays fully invested through every drawdown. That strategy delivered a 98.8% success rate. 961 of 973 retirements ended with money to spare. The median legacy was £995,200. Only 12 retirements failed.
|
Rules off (stay fully invested) |
|
|
Success rate |
98.8% (961 of 973 scenarios) |
|
Failed |
12 (1.2% ran out of money) |
|
Median legacy |
£995.2k (10th-90th percentile: £284.6k to £2.04m) |
|
Min / Max legacy |
£512 to £2.79m of surviving scenarios |
|
Panic triggered |
0 (0% of scenarios) |
|
Re-invest triggered |
0 (0% of scenarios) |
Switch the rules on, and the same retirees fare meaningfully worse. The success rate falls to 91.8%, and the median legacy drops to £725,300. The typical retiree hands their estate £270,700 less to inherit. The panic-sell rule fires in 860 of 973 scenarios (88%), and the re-invest rule fires in 840.
|
Rules on (panic-sell and re-invest) |
|
|
Success rate |
91.8% (893 of 973 scenarios) |
|
Failed |
80 (8.2% ran out of money) |
|
Median legacy |
£725.3k (10th-90th percentile: £162.7k to £1.86m) |
|
Min / Max legacy |
£1.7k to £2.75m of surviving scenarios |
|
Panic triggered |
860 (88% of scenarios) |
|
Re-invest triggered |
840 (86% of scenarios) |
The terminal wealth distributions make the cost evident. With rules off, the histogram extends comfortably out to £2.79m. It has a healthy right tail and a relatively short left tail.
Rules Off
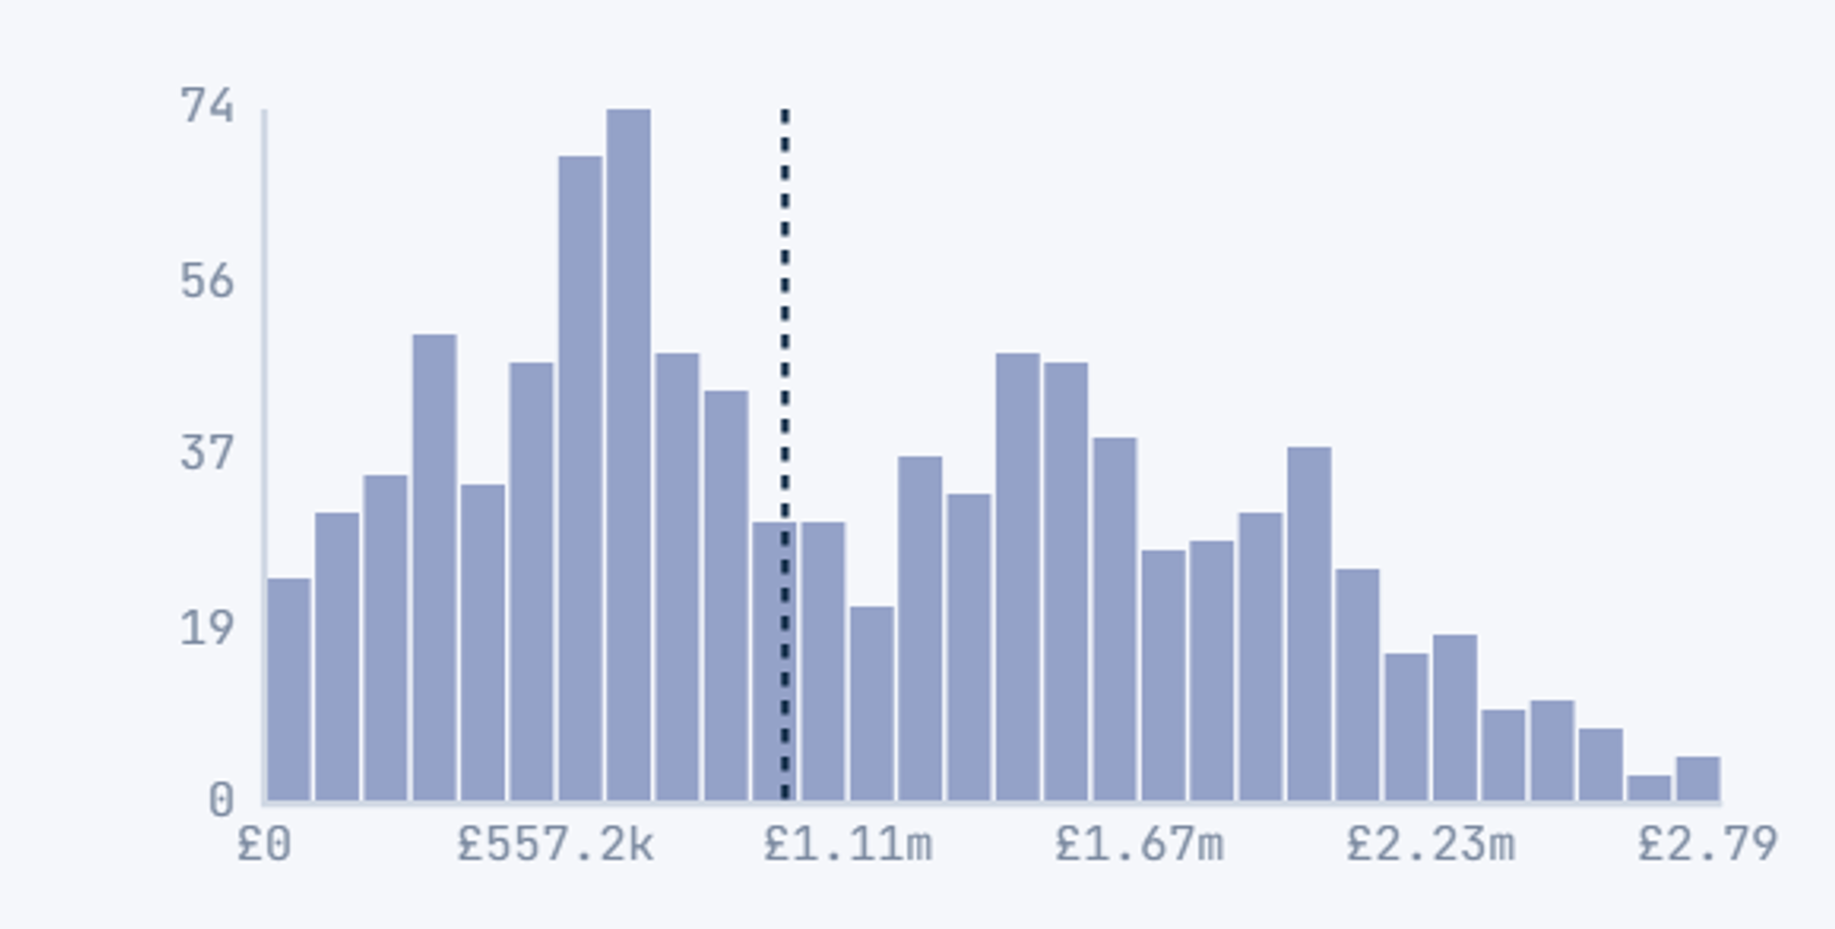
With rules on, the entire distribution shifts left, the peak migrates toward zero, and the long left tail of failures grows.
Rules On
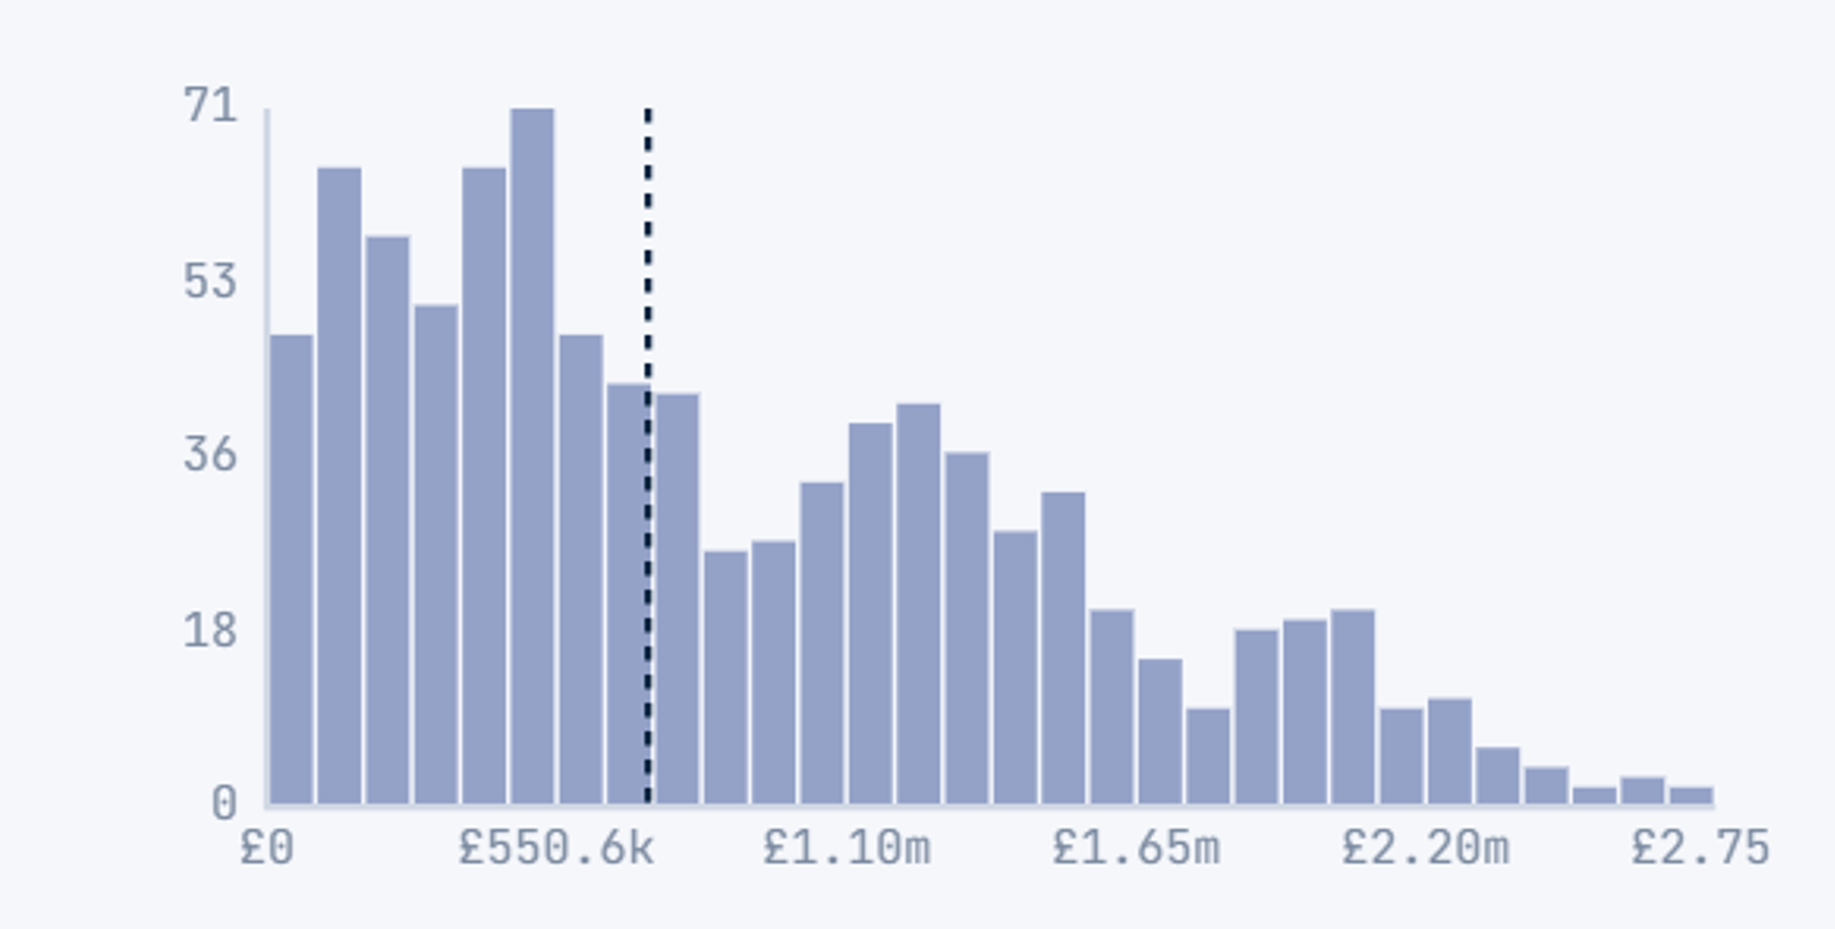
© Timeline Holdings Ltd 2026. Source: Timeline using data from Morningstar (provided without liability). Global Equities: Morningstar Global All Cap Target Market Exposure Index. Terminal wealth across surviving scenarios. The dashed line marks the median.
Past performance is not a reliable indicator of future results.
The takeaway
For retirees and the advisers who serve them, historical evidence highlights the value of a structured approach. While retirement plans should be reviewed and adapted as circumstances evolve, the principles behind them often remain unchanged: rebalance systematically, manage withdrawals thoughtfully, and stay focused on long-term objectives.
The challenge is rarely finding a new strategy. More often, it is maintaining discipline through changing market conditions and resisting the urge to react to short-term noise. Supporting clients through those moments and helping them make better long-term decisions is where advisers can have the greatest impact.
Important: This blog is prepared exclusively for use by financial advisers; retail distribution is at the adviser's sole risk and discretion. It does not constitute advice, an offer or a solicitation to invest. Every client’s financial circumstances, objectives, and income needs in retirement are different. A strategy that is appropriate for one investor may not be suitable for another, and any approach should be reviewed regularly in light of changing personal needs and market conditions.
Compiled from sources believed to be reliable. Any views, opinions or estimates expressed, including any forecasts or forward -looking statements, constitute the author’s judgment at the time of writing, are not guaranteed and are subject to change without notice. None of Timeline, its directors, officers or employees accepts liability for any loss arising from the use hereof or reliance hereon or for any act or omission by any such person, or makes any representations as to its accuracy and completeness.