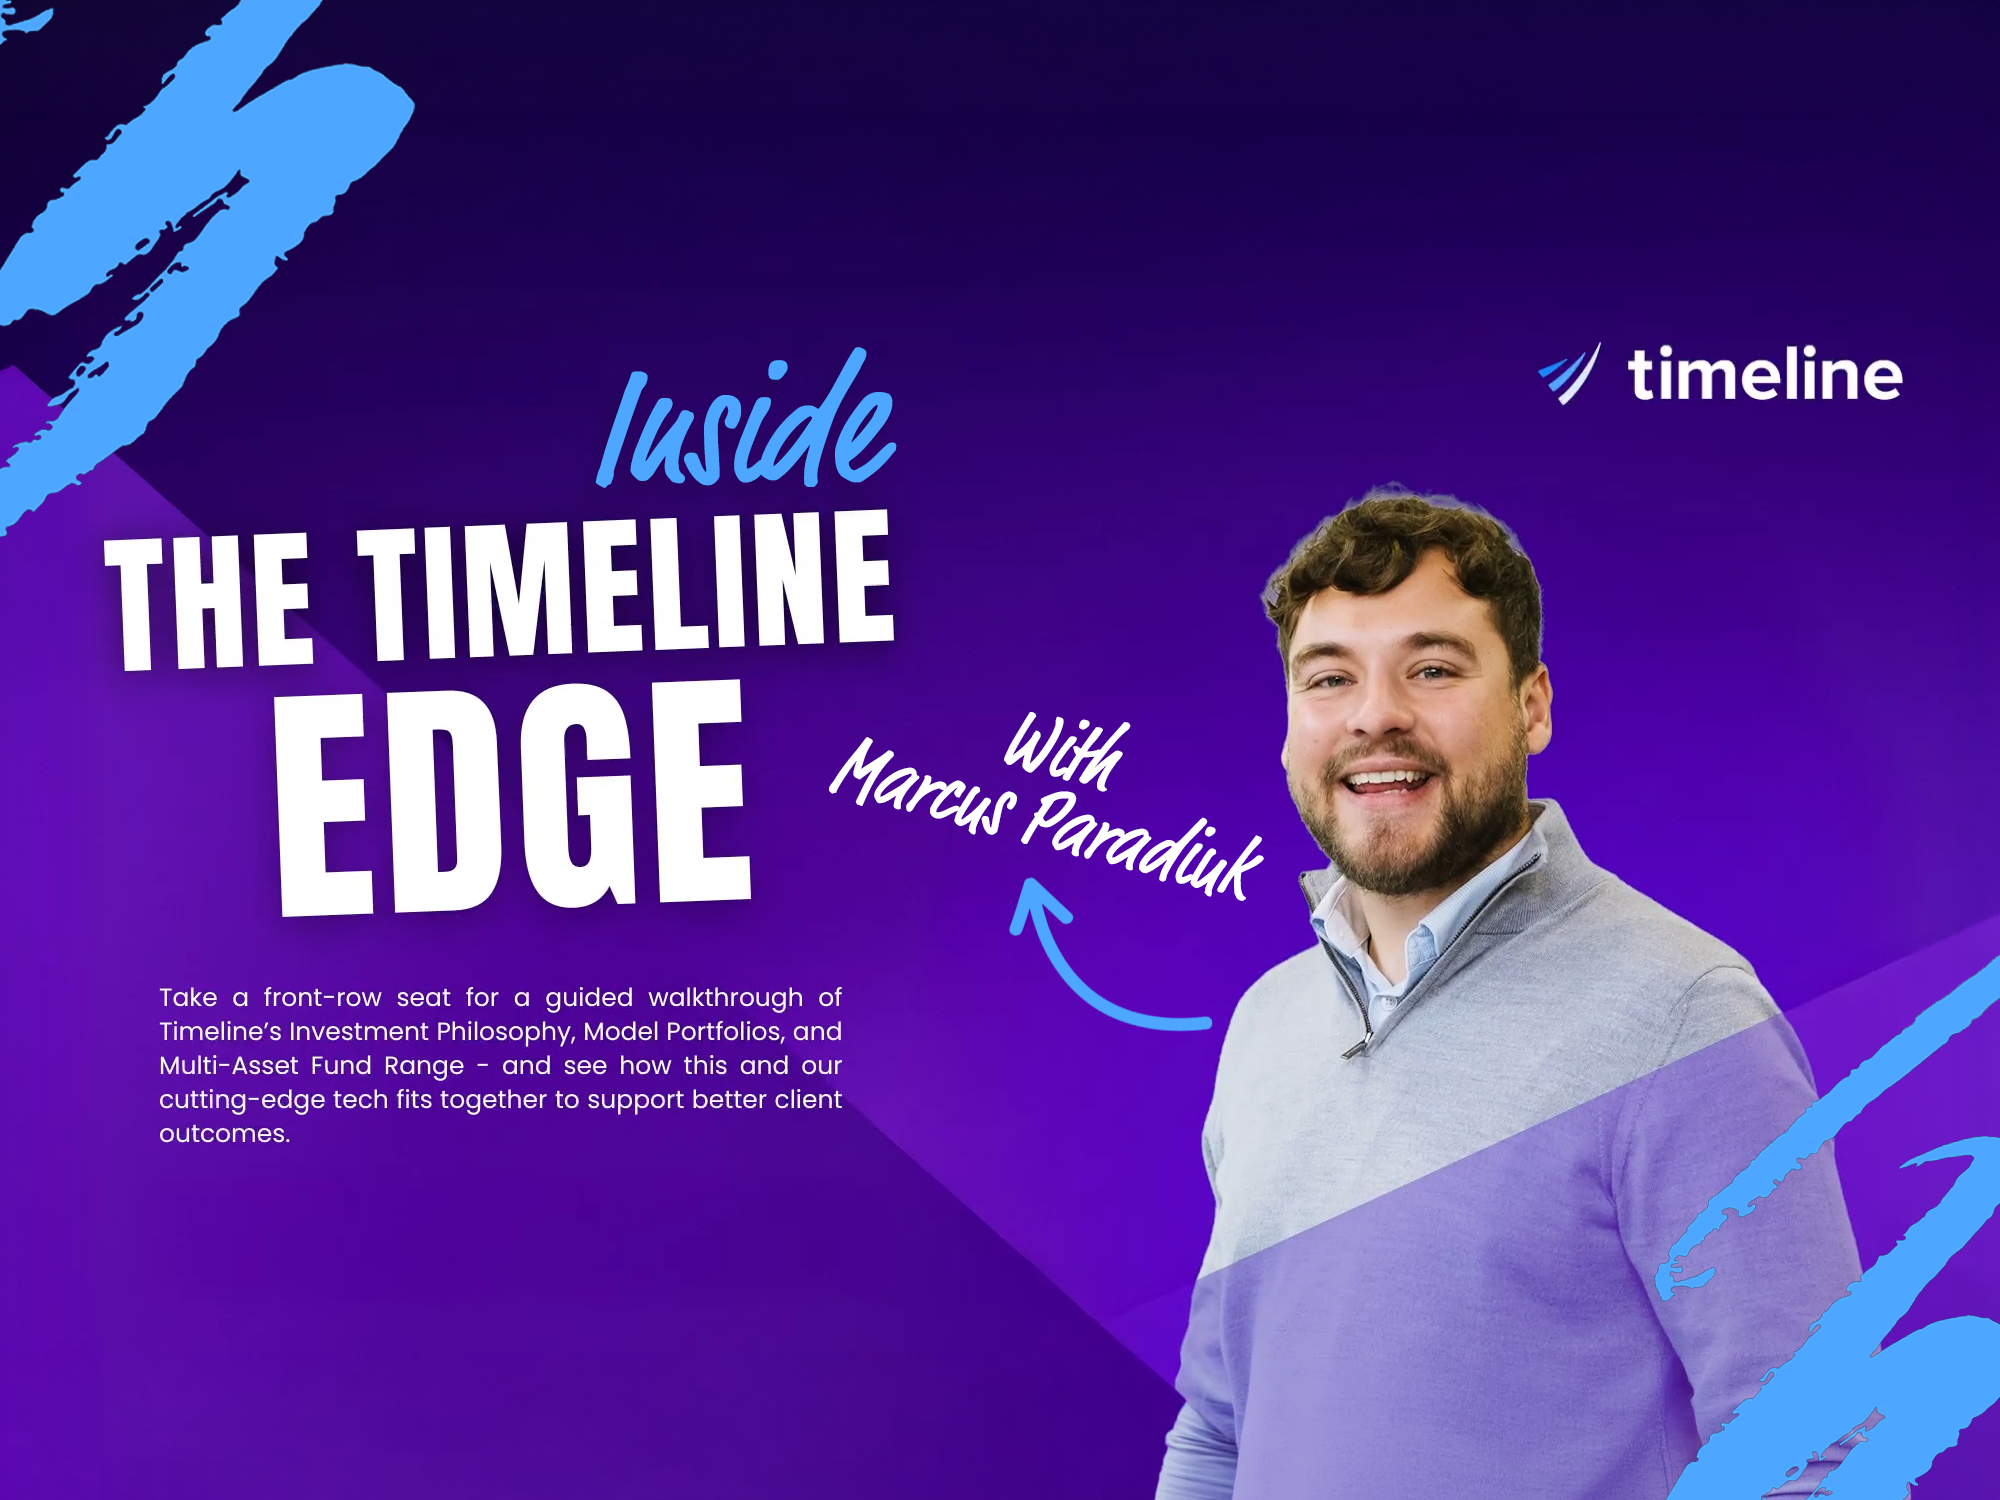
Marcus Paradiuk
Business Development Manager, TimelineTimeline's April Edge session delivered a live tour of the platform's investment ecosystem, covering everything from the evidence-based philosophy underpinning the model portfolios to the planning tools that support the full advice journey. Marcus Paradiuk, Business Development Manager at Timeline, guided attendees through the latest updates and demonstrated how the integrated suite helps advisers work more efficiently and deliver better client outcomes.
What we covered
The session moved through four key areas: the investment philosophy and portfolio construction behind Timeline's model portfolio service, how factor tilts and cost-efficiency drive long-term returns, a walkthrough of the integrated planning technology, and a look at the Timeline Charts 2026 and how advisers are using them in client conversations.
Investment philosophy
The evidence-based framework underpinning Timeline's approach to long-term wealth creation for clients
Factor tilts
How small-cap and value tilts are incorporated to target higher expected returns over the long run
Cost-efficient investing
Why keeping costs low is a primary driver of net returns, and how Timeline's fund range achieves this
Portfolio performance
An update on how the Tracker and Classic model portfolios have performed across recent market conditions
Planning technology
AI-enabled factfind, cashflow modelling, IHT planning, digital LOAs and the client portal, all from one login
Timeline Charts 2026
The new edition of Timeline's data-driven visual suite, covering 1926 to today across all major asset classes
The investment philosophy
Timeline's approach to investing is grounded in academic research and nearly a century of capital markets data. Rather than attempting to predict short-term market movements or select individual securities, the philosophy is built on three principles: broad global diversification, rigorous cost control, and long-term discipline.
The session walked through how this translates into practice. The Tracker range captures market returns efficiently through low-cost index funds, while the Classic portfolios incorporate factor tilts towards value and small-cap companies, where the academic evidence for a long-run return premium is strongest. The common thread across both ranges is a belief that capturing market returns after costs is the most reliable path to long-term wealth creation for clients.
"Time in the market beats timing the market. Staying invested, remaining diversified, and focusing on long-term objectives has historically been the most reliable path, and that holds true regardless of what markets are doing in any given quarter."
Factor tilts are not a short-term trade. The value and small-cap premiums have long periods of underperformance, and the session was clear that advisers using the Classic portfolios should understand this and be able to explain it to clients. The evidence for these tilts is strongest over longer time horizons where the underlying logic, compensation for risk and the correction of behavioural mispricing, has room to play out.
Staying the course in volatile markets
April's session arrived against a backdrop of heightened market uncertainty. Geopolitical tensions, inflation concerns and shifting central bank expectations have all contributed to volatility in recent months. The session addressed this directly, using the Timeline Charts 2026 to place current conditions in a longer historical context.
The key message for advisers: volatility is not a flaw in the investment process. It is the price investors pay for higher long-term returns. The Timeline Charts illustrate, with nearly 100 years of data, that markets have navigated every previous period of upheaval and rewarded disciplined long-term investors.
For advisers, this context is invaluable. When clients are reading headlines about trade tensions, interest rate decisions or political change, showing how markets have behaved across similar conditions, across recessions, political cycles, wars and financial crises, is far more effective than verbal reassurance alone.
The Timeline Charts 2026
The April session featured a walkthrough of the Timeline Charts 2026, the latest edition of Timeline's suite of data-driven visuals covering inflation, cash, bonds, property, gold, equities and diversified portfolios from 1926 to the present day.
The charts have become one of the most widely used client communication tools among Timeline advisers. In periods of market stress they are particularly powerful, helping advisers move the conversation from short-term anxiety to long-term perspective. The 2026 edition includes new charts examining wealth creation at the company level, illustrating why global diversification matters more than individual stock selection. It also updates the political cycle analysis, showing once again that markets have delivered strong long-term growth regardless of which party holds power.
"The charts don't tell clients what markets will do next. They show what markets have done before, and that's a far more honest and useful thing to share."
The full 2026 Charts are free to download for professional use at timeline.co/timeline-charts.
One login, one ecosystem
The second half of the session demonstrated Timeline's integrated planning technology, with a focus on how recent updates support the full advice journey from initial discovery through to ongoing review, without requiring multiple logins or manual data transfer between systems.
AI-enabled factfind. The updated factfind uses AI to generate personalised follow-up questions as clients work through their financial objectives, helping advisers surface goals and priorities that a standard questionnaire might miss. Each completed factfind produces a structured summary combining financial data with softer context, reducing manual note-taking and improving meeting preparation.
Cashflow modelling and stress testing. Plans are stress-tested against over 100 years of real capital markets data rather than Monte Carlo assumptions, giving clients a historically grounded view of their financial future. New withdrawal ordering functionality helps advisers show how income can be drawn from different wrappers in a tax-efficient sequence, supporting clearer retirement income conversations.
IHT planner. Timeline's IHT planning module allows advisers to model future crystallisation events, trust structures and legacy scenarios. This is particularly relevant given the evolving pension inheritance rules taking effect in the 2027 tax year and beyond.
Digital LOAs and KYC/AML. Automated letters of authority and integrated know-your-client checks significantly reduce the admin burden associated with onboarding. For smaller advice firms, this capacity saving can be transformative, freeing adviser time for the work that actually drives client value.
Portfolio analytics. The updated analytics dashboard lets advisers compare up to six portfolios side by side, with inflation benchmarks and adjustable timeframes. Dashboards export to PDF with only selected charts included, making it straightforward to produce clear, relevant client reports without unnecessary clutter.
Questions from advisers
Why hold fixed income when yields are rising? Fixed income in a Timeline portfolio serves a diversification purpose rather than acting as a cash equivalent. The low correlation between bonds and equities over the long run means they continue to play a valuable role in managing portfolio volatility, even in a higher-rate environment. Moving to cash to avoid bond drawdowns means attempting to time the market, which runs counter to Timeline's core investment philosophy.
How does rebalancing work in practice? Timeline uses tolerance-based rebalancing, meaning portfolios are rebalanced when asset class weights drift beyond a set threshold rather than on a fixed calendar schedule. This approach is more tax-efficient and ensures the portfolio stays aligned to the client's target risk profile without generating unnecessary trading activity.
Can I use Timeline alongside my existing DFM? Yes. Timeline is designed as an open ecosystem and supports advisers who use third-party DFMs within their planning workflows. The platform integrates with a wide range of back-office systems and custody providers, so there is no requirement to switch everything at once.
Have a question for the team? Email support@timeline.co and they will be happy to help.
Want to see more?
If you would like a personalised walkthrough of Timeline's tools for your firm, you can book a demo with the team.
The Timeline Charts 2026 are available to download free at timeline.co/timeline-charts.
Timeline Portfolios Limited is authorised and regulated by the Financial Conduct Authority (FRN 840807). Registered in England and Wales, RC: 11557205. 70 Gracechurch Street, 4th Floor, London, EC3V 0HR. Past performance is not a guarantee of future returns. The value of investments and the income from them can fall as well as rise, and you may get back less than you invest. Transaction costs, taxes and inflation reduce investment returns. This content is intended for professional financial advisers only and does not constitute financial advice.