April
For Financial Advisers Only
A guided demo of Timeline’s investment solutions, technology and adviser-first processes. Fill in a quick form and watch the full tour at your leisure to get a taste of how we can support you.
Here's what to expect...
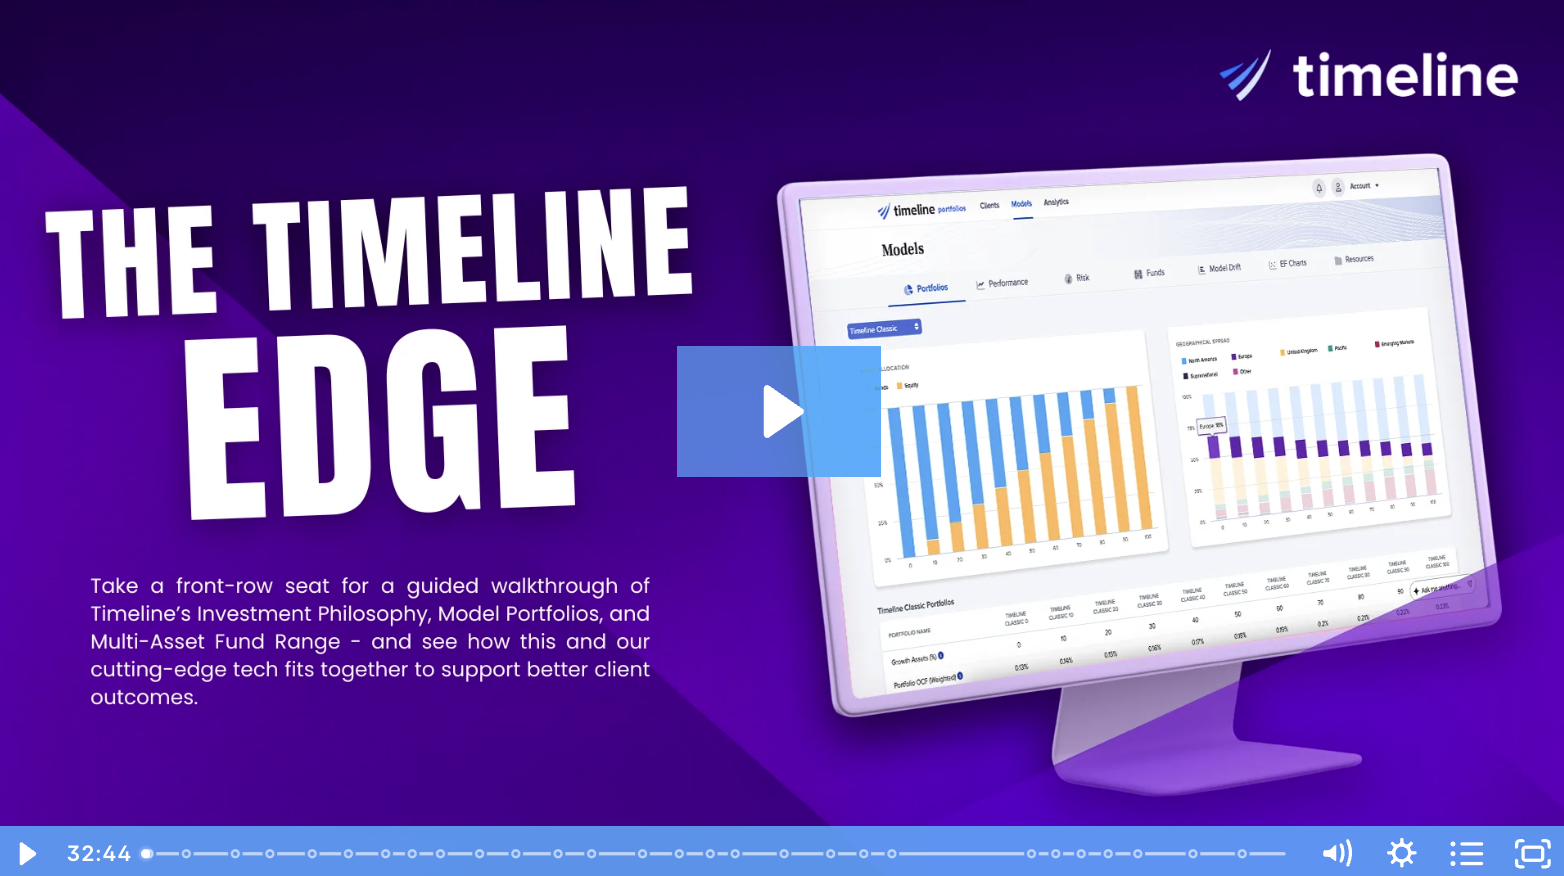
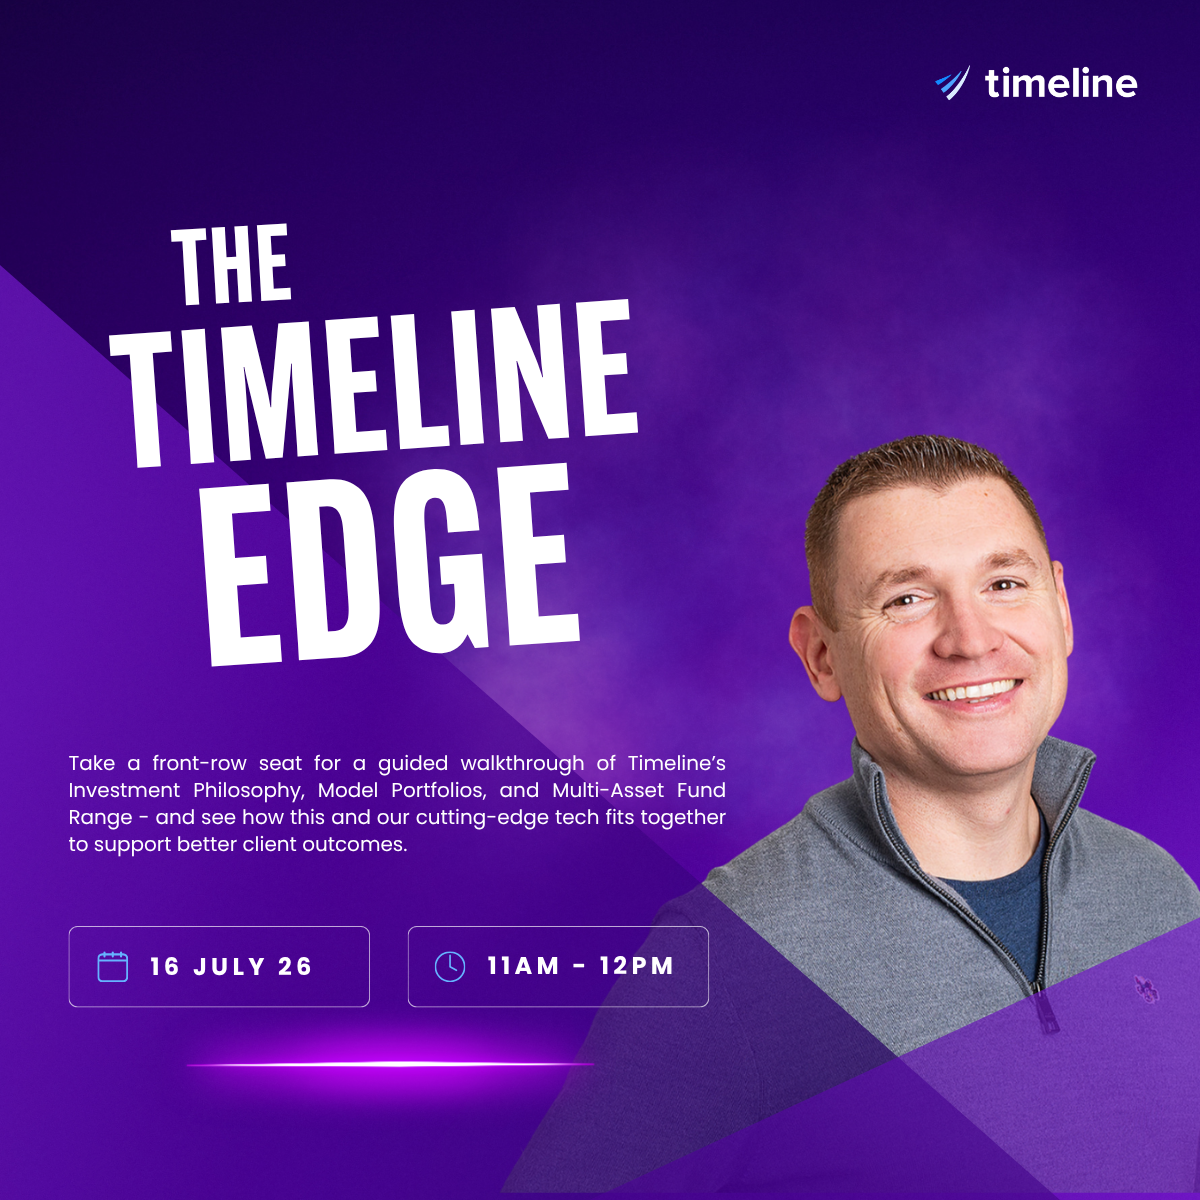
Take a front-row seat for a guided walkthrough of Timeline’s Investment Philosophy, Model Portfolios, and Multi-Asset Fund Range - and see how this and our cutting-edge tech fits together to support better client outcomes.
In this tour, we’ll show you how our mission - to help millions plan, invest and retire with confidence - comes to life through a fully integrated ecosystem that blends smart technology with low-cost, evidence-based investing.

A guided demo of Timeline’s investment solutions, technology and adviser-first processes. Watch this full tour at your leisure to get a taste of how we can support you.
FOR FINANCIAL ADVISERS ONLY
Explore the Technology and Investment Solutions helping Financial Advisers grow.
Here's where you can learn more about Timeline. Dive into the tech that's been built for firms just like yours.
Explore the investment solutions designed to give your clients better outcomes.

You're in the right place. Get to know us – at your leisure.
Here's where you can learn more about Timeline. Dive into the tech that's been built for firms just like yours.
Explore the investment solutions designed to give your clients better outcomes.

Check out this selection of webinars you can watch on demand at your lesiure.
And we are away. Good morning, everybody. I hope you're all well. I hope you're all staying cool to be from as well. And the heat wave, it can be difficult. So thank you very much for joining us today. And today, what a session we've got. It is another Timeline Ed session we have for you. Our second one, actually. And today, we are joined by Dan, who's always gonna run you through everything, essentially why you just need Timeline, not only in your life, but in your business as well. Good good morning all. Just a little bit of background on myself just in case some of you haven't met me before. So named Dan Kelly. I am the BDM covering Scotland and Ireland as you may have guessed with Foghorn Voice. And, yeah, so I've been at TimeLine for just under eighteen months now, previously six and a half years doing a summer role at Royal London. And, yeah, you mentioned the heat wave. You'll be surprised it's even made its way up north north. We've got twenty six degrees today, usually usually about eighteen degrees with barbecue weather, but it's it's went past that. Thankfully, my house is north. This is north facing, so I don't get the heat in this in this my small office. So, again, if we do have questions as we work, we are going to do a q and a at the end. If there is anything that you think you really want to ask at this moment in time because I'm covering it in detail, please do just put your hand up or whatever it may be. We can we can answer questions as we go as well if it's if you feel it's really urgent to ask it then. Some of you may have seen this before. So this is the timeline chart. Alright? We update this every single year, and it shows the last one hundred years of history for different investment classes. Alright? So or asset classes, sorry, I should say. So apologies. This is the largest I can make it. We'll show it all in one screen. I will zoom in in a second just to focus on different sections. But what you'll see here is all asset classes are shown from one thousand pounds with the exception of UK equities, which is shown from one pound just to give it a clearer visual. Alright. Down the right hand side, what you'll see here is the highest performing asset class all the way down to the lowest performing asset class over that one hundred year window. Alright? The percentage on the left hand side is the performance. The percentage on the right hand side is the volatility. Alright? And when I run over this with advisers, one of the key elements that I like to pull out is that if you look at a balanced portfolio k. So the balanced portfolio is fifty percent in global equities and fifty percent in bonds, fixed interest, etcetera. And that over the last one hundred years has averaged a ten percent annualized return. So one of the main philosophies of timeline that you're welcome to is that global markets are really, really efficient. So for your clients, you know, how many, if they were invested in fifty percent equities, would be pretty happy with a ten percent annualized return, and I would imagine that it's quite a high percentage. So one of our philosophies says, instead of actually trying to beat the market, can you buy the market at a really low cost? Which is where we have one of our main portfolio ranges is called the tracker, alright, which I will come to in more detail. Alright? At the other side of that, okay, history does show is that there has been asset classes that do outperform the market. Alright? So if you look at the very number one, number top sorry. Number one at the top emerging markets is the highest performing asset class averaging thirteen percent annually. However, it is more volatile. So what we have in instead of with the that sits alongside the tracker is your classic portfolios, which have factor tilts, which if some of you have experience with dimensional, you're probably well aware of factor tilts, but it's got four main factor tilts, which I will cover in more detail. But it's value companies, profitable companies, small cap companies, and emerging markets, surprisingly enough. And looking at this chart as well, something one of the key bits of information we feel that that also pulls out as well. So if I come back to the balanced portfolio, so it's number six in the purple line, come up to the top left hand side. Hopefully, you can see my cursor circling. I will try and highlight it here. As in the last one hundred years, a balanced portfolio has had a positive return eighty two percent of the type. So approximately four out of every five years, a balanced portfolio will have a positive return looking at history. However, when the the order of the returns, when the years that will happen, we don't know. And that is the hard part, isn't it, in terms of the adviser point of view? So for the timely chance, I just wanted to go into this in wee bit more detail. We can we can email this over if you would like it in more detail. Alright? Some of the key elements we'd like to pull out. If you look at the bottom, I will zoom in here. So this shows the last one hundred years. The last one hundred years, there has been eleven bear markets, but every single bear market in that time has been followed by a longer and higher bear market every single time. We believe that that you know, the data can show that history does repeat itself, and everything that we do is based on the evidence of history, based on the timeline. Hence, we are called timeline. Those are couple of elements I just wanted to if you want to see this in a bit more detail, there are it compares decades. Just scroll this down. Yeah. So the highest performing asset class in various different decades. So you'll see gold maybe hasn't been in talked about as much over the last six months, but it it did maybe about twelve months ago. So it has been some years the highest performing asset class. However, if you flip that all the way down, it's had numerous decades where it's been the lowest performing asset class. And the very final thing I wanted to show you on the timeline chart regarding bill and bear markets. Yeah. This number here. So the average bear market in the UK has lasted eighteen months with a drop of thirty four percent, whereas the average bull market in the UK averages six years eleven months with a growth of four hundred and sixty four cent. So, again, we believe this demonstrates that markets are really, really efficient. So this is the timeline, a control center, timeline super app, alright, that we like to call it. And this is where you get all the breakdown of your underlying portfolios. Okay? So as I mentioned earlier on, we have the timeline tracker and the timeline classic, which are our two main ranges. And we also have ESG versions of. I wasn't gonna touch too much on the ESG versions today. If you would like to know more details on that, please contact your regional BDM, which I will speak about at the end. And also last year, we did launch multi asset funds, which are a unitized version of the tracker. So I will go into detail on the multi asset funds, but when I'm discussing the tracker, it is the exact same underlying holdings. It is the exact same asset allocation. It's just all held within the one fund. Alright? So if you look here at the timeline tracker, alright, we have each each of our ranges have eleven different portfolios. Okay? All gone up in ten percent equity increments. So from one hundred percent bonds all the way up to one hundred percent equities. In case any is wondering why that says ninety eight percent equities and I said one hundred percent equities, you will be aware of some platforms insist on a two percent cash holding. So we have this built I have this built into my system. You don't have to have that, so that's not from our side on the portfolios. So if you are invested in, say, funding, well, that's not the case, then it would be one hundred percent equities. If it's TRANZACT, then it would have the the two percent cash holder. Alright. So if we look at the one hundred percent equity portfolio, k, you'll see currently sixty six percent in North America. Last time I looked, it was about three, four percent in Canada. So you're looking about sixty two, sixty three in in America itself. You've got eleven percent in Europe, three percent in UK, eight percent Pacific, and then twelve percent in emerging markets. And the tracker, as I mentioned earlier on, is global market cap. So what the global market cap tells us to do is where we will hold the equity content in of the tracker portfolios. Alright? So if you flip this back to the early nineteen nineties, that would show about thirty percent in the in in Japan. Not the case at the moment. And month on month, quarterly for emerging markets, we'll rebalance not rebalance. That's the wrong word then. We will adjust that depending on what the global market cap is is telling us to do. Alright? Flip this now to the one hundred percent bond portfolio. Okay? And you will see a slightly higher holding on the, you know, safety side in in in the United Kingdom. Alright? And that's for a multitude of reasons, you know, interest rate risk, currency risk, inflation risk, etcetera. So with the defensive assets, we will hold more in the UK And for the growth assets, we don't have that bias. Alright? And just to let you know as well, we have the one hundred percent bond portfolio and the one hundred percent equity portfolio, and everything in between is a mix of the two. Alright? So it's not that we have, you know, higher risk bonds for a higher risk client or lower response. For a lower risk client, it has two portfolios mixed. Alright? Just to let you know, if you are to come on board with Timeline, you don't have to offer all eleven portfolios. You know, I was speaking to a firm yesterday, and they said, yeah, we wouldn't have we wouldn't have an option before below forty percent equities. So you could maybe have forty, sixty, eighty, one hundred entirely up to yourself. You can have them all, or you can have the portfolios that you think that you would be more likely to use. In terms of tracker, so we have a DFM fee or an agent as client as nine basis points. Alright? We do offer reliance on others as well, and the DFM fee for that is twelve basis points. Alright? So depending on which way you prefer agent as client reliance on others, the great news is that we do offer both. And in terms of the OCF for the funds, you'll see here between six and seven basis points. Sold out. There is transaction costs. You'll see there between eight bips and and four bips, but I'm well I'm gonna come back to that later on as well when I do the show you the analytics tool order. In terms of the the funds underneath, so there's five on the bond side, six on the equity side, and, of course, that means there's eleven for everything in between the actual underlying funds themselves. So on the bond side, we have Northern Trust and Vanguard. And on the equity side, we have legal general Northern Trust, Vanguard, and Aisha. So unfettered funds are funds, and we can and do monitor these underlying fund holders, and we do make changes where we think it will improve client outcomes. So if we were to have held a conversation on the timeline last year looking at the proposition, our OCF for all tracker portfolios at the time was nine basis points, whereas we made changes in November, December last year, which allowed us to change some of the underlying holdings and also reduce the cost for the incline. Another strong element of the proposition, alright, that coming from my background, to be honest, I I had never seen anything like this before. Alright. So we have what's called the portfolio snapshot. Okay. So I'm gonna click on to the portfolio snapshot just now. So it'll give you all the underlying holdings, the cost, and the percentage that are held within the portfolio, the equity content, each fund between equity and bonds, where the assets are held between, you know, North America, Europe, emerging markets, etcetera. Also gives you performance or cumulative, annualized, you can do benchmark into the RPI, net of fees, gross of fees. And but what are the strongest elements? So you'll see here all data correct as of the fifteenth of July. So your own portfolio snapshots update daily to the previous working day. Alright? I know you may use, you know, Effie Analytics or whatever it may be, but from our own system, you're pulling the most up to date information. You can produce that as a PDF. And something actually I I didn't mention at the start that maybe I should have. So this whole system as well that I'm showing you, I'm always a Timeline employee. It logged in under my Timeline email address. So everything you'll see here is Timeline branded, timeline colors, timeline logos, etcetera. But this can all this is can all be white labeled to your own brand and your own colors, your own logo. So when you're producing reports off our ecosystem, won't look like it's produced, you know, for timeline, by timeline, to promote timeline. You know? It can be used if you wanted to use another provider as well. Obviously, we don't highly recommend it, but it it can be used for that purpose. Alright? Okay. So that's that that that's the breakdown of the tracker portfolios. In terms of performance, alright, really, really strong. And, again, we show all this on the on the website. You can do a cumulative, annualized calendar, and you can do net of fees as well. And to discuss performance as well, I'd already prepared this. Alright? So this is MorningStar's own website. Again, we can send links to this if you want to have a look. So you can look at all the different NPS providers, in the UK. Again, it's just over sixteen hundreds. You can, you can filter this to just specific providers. So if you wanted to compare timeline with Tan or timeline with Aberdeen or whatever it may be, timeline with Aspen since they're on the screen. So what I've done here is I've filtered the performance to the five year figures. So the tracker portfolios are just about six years old now. So we don't have ten year figures, but we do have the five year figures. And this shows the top twenty, and, of course, obviously, it shows timeline in a good light. We have been number one. We have been number two. We're setting number three at the moment. We've got two or three within the top twenty. But what always jumps out in me here, if you take the provider's name away at the moment, alright, passive tracker, passive, passive, passive, passive tracker, index, passive, and that's across ourselves. That's across Parmenian, Tatten, loads of different providers' names. And you think of everything that's been on in the last five years, you know, we've come out the tail end of COVID, the list trust mini budget, which was a complete disaster. And Donald Trump's came back in the liberation day. We've had numerous wars. I'm starting to lose count of the amount of prime ministers we've had in that time. It has been a pretty volatile five years, and yet active managers have found it very, very hard to beat, you know, passive portfolios regardless of the provider. And another bit of information that we believe backs us up, and you may have seen this before. If not, again, we can share the links here. So, this is SMP. So they do research on indices versus active management, and it covers a variety of different countries. So it defaults to the US at the Okay? So this shows over fifteen years. So that's comparing s and p five hundred against active management in the US. And over fifteen years, it's showing, you know, ninety percent under perform the S and P five hundred. And if you look at various different time periods, you know, then the percentages may change slightly, but it still tells a pretty similar story. And, of course, you could argue, you know what, America's the most developed market in the world, probably the most analyzed. It's maybe the hardest for, you know, active managers to find a competitive advantage. But we go to other emerging markets here, you know, Brazil, so it's it's it's eighty percent underperform SMP. If we go to Europe, again, we've only got the ten year figures here, but that's even worse. You know, it's it's it's only three percent are outperforming. So we are not completely active anti active management, and I'm not completely active act anti active management myself. But I do think for active management, you either need to outperform or you have to give similar returns but in a much smoother journey. Not that I'm talking up the proof on that was just the word that, that came to my mind. So in terms of active management, we believe that it's very, very difficult to pick the winners consistently. So that's why we have the tracker portfolios. Alright? Now where I am going to flip this back, alright, as to our classic range. Alright? So as I mentioned earlier on, where we view it as very, very difficult to beat the market over the long term, we do not think it's impossible. Alright? Because there are asset classes that have shown to outperform the market, And that's where the classic portfolios come in. Alright. So as I mentioned earlier on, but I will reiterate, there's four main factor tools within the classic portfolios. Small cap companies, value companies, profitable companies, and the merchant markets. And you'll see this the the difference. Okay? So, actually, one thing, I'm just gonna flip this back to the tracker. So apologies for that, Jake. All I want you to show here so the North American holding and the one hundred percent equity portfolio is sixty six percent, twelve percent in emerging markets. Alright. So let me now flick this back to classic. Apologies, everyone. So what you'll see is so America has now dropped to fifty six percent, and you'll see emerging markets has claimed up to twenty one percent there. So you already see the factor tilts taken taken action just in terms of where the assets are held geographically. Now in terms of the underlying holdings, so due to the fact that such a third of these portfolios and active management, you will see there's a slight difference in cost. So the classic ranges, exact same DFM fee, so nine basis points for agent as client, twelve for alliance or others, but it's thirteen basis points up to twenty three basis points. So you're looking at a you know, as agent as client, you're looking at a total cost from the timeline of, you know, between twenty two and thirty two basis points. So still really, really low cost, although not as low as the tracker itself. I I won't go into the portfolio snapshots, but the exact same things available there. In terms of the underlying funds, so there's three on the bond side, five on the equity side, what you will see as some of the names have changed. So what you will see here is that dimensional have come in in both the bond and the equity side. And what you will see is their holdings pretty much always total up to about thirty three between thirty three and thirty four percent. So about one third of the portfolio, and this is where the factor tilts is coming in from. And you also see with Vanguard on the small cap again, another element of the factor tilts coming in there. Alright. In terms of risk rating, so you'll see our our portfolios frustrated by most of the big names in terms of Finimetrica, De Facto, Oxford Risk, and Dynamic Planner. If you did want to look at the underlying holdings, all that information's here. So we've got the kids. We've got the fact sheets. All that information is here, on the on the website. One bit of information I do want to touch on then I'm gonna come back to the multi asset funds. Sorry, Jake. That just keeps popping up, is how we rebalance, and this is in both the multi asset funds and in the NPS itself. Alright. So as I mentioned earlier on, timeline we base everything on the evidence, everything on the research, everything on the timeline, and that doesn't change when it comes to rebalance. Alright? So you'll see here and, again, we can send all this over if you would like to look at it in more detail. But what what we do is we'll be run a one hundred thousand pound portfolio, invest in fifty percent global equities, fifty percent bonds over a thirty year investment horizon. We've done that for pretty much a one hundred and eleven years, so from January, nineteen fifteen up to the end of December last year, and we compare quarterly rebalancing, annual rebalancing, five percent drift, and ten percent drift. Alright. We, again, look at the evidence and what that tells us to do. Alright? What you'll see, this this compares the worst, the the middle, and the best, but we can do this in a much deeper dive. And what you see in terms of annualized returns, number of rebalances, and the portfolio value, everything points towards ten percent rebalancing being the best end outcome for the client. So our portfolios and our multi asset funds rebalance on a ten percent drift. So what that means is for your I'll just keep using sixty forty if that's okay because that's involved the the research use and what I've mentioned a couple of times. So a client is in a sixty forty portfolio. Their portfolio can drift up to seventy percent equities. And at that point, that's when we will rebalance the portfolio back to sixty forty. On the flip side, I know nine out of ten rebalances happen on a positive. But on the flip side, if there was a drop in markets and equities to fall to fifty percent, we would then buy back in when, obviously, there was hopefully a value buying equities as well and bring that client back up to the sixty forty. Alright? So if you do want this, it's a it's a twelve page document. So won't run over it in detail here, but we can send this over after the call if you would like in more detail on how we rebalance. Alright? And something that you can access, which is why I brought the rebalance it up, is where the portfolio set on that drift at the moment. So, if it's okay, I'll move this to a sixty forty again just because that seems to be the one speaking about more than others. So you'll see here with Fundament, the classic sixty forty is currently setting at sixty seven point six six percent. So it's not due to rebalance anytime soon, but, of course, if markets were to take an uplift over the next, you know, year or so, that would maybe trigger a rebalance, for clients in that portfolio with Fundament. Now I did mention the multi asset funds earlier on. Alright? So I'm not gonna go into these in in loads of detail for the reason that they are the exact same as the timeline tracker that I mentioned. Alright? But there is some differences in terms of the number of portfolios can cost, and so I just wanna make sure I'm I'm hitting on that at the moment. Alright. So we have four main, fund ranges, for the Timeline multi asset funds, and that's forty percent equities, sixty percent equities, eighty percent equities, and one hundred percent equities. And you'll see by the names that we have, that's due to the rebalancing. So that came from the FCA. So when we were putting forward the names for the portfolios because of how much equity content can be held, that's why it's called the thirty fifty equity fund. Alright. Now one of the main reasons for introducing, the multi asset funds, it was to do with GIAs and CGT issues. I'm sure many of you on the call have probably had issues with funds rebalancing and it causing gain for your clients. And with regards to we've had ourselves. So with regards to the multi asset funds, by having a unitized version of the portfolios, this allows us to, you know, rebalance within the fund and not trigger that gain until the the full fund has been sold or part of the fund has been sold. Alright? But the exact same underlying funds are held in the tracker that are held in the multi asset fund and the exact same percentages. Alright. Where there is a small difference as there's no DFM fee for the multi asset funds, so there's not the the DFM plus OCF. So it's just one fee, which you'll see there on the screen. It's twenty basis points for the multi asset funds. Alright? And, again, if you do have any questions, please, of course, put them in the chat, or we can answer at the end. Should we we've got one from Melanie, if you wanna go for it. Yeah. Can you just explain what is an NPS and how does that differ from other multi asset funds? Okay. Yep. So let me I'll I'll demo this. So the multi asset funds probably the the best way to let me just gonna try and give a visual here if that's okay for Melanie. Alright. So so the NPS so this is how I would love it. Okay. You may be ask someone else, and they'll get a slate you know, they'll give you a slightly different answer. Okay. So the main difference between our own multi asset fund and NPS. Okay. So the NPS is a portfolio that will hold all these individual funds underneath it at the set percentages that you're seeing on the screen. Alright? Okay? So we can chop and change out any of these underlying funds, whether that's due to we feel we can improve performance or whether we can improve cost into the end client or reduce cost into the end client. So that is a portfolio, and there is funds held within that portfolio. So portfolio is the header. The the funds are held underneath that under the set percentages. What the multi asset fund does is we are actually just holding it as a one so as in one of these individual funds. I'm just gonna pick Vanguard here. And then underneath, we're holding the assets in that set percentage. But the the the advantage of it, as I say, is any rebalancing that happens happens within the fund. So we've not sold we've not sold these assets which triggers which can trigger, obviously, depending on growth, etcetera, but it can trigger a a CGT liability within GIS. So that's that was the main reason for the launch of the multi asset funds or one of the the main reasons for the launch of the multi asset funds. Perfect. I hope that helped, Natalie. Obviously, get back in touch if if you wanted more clarification or anything else. Go on, Daniel, gonna say something? Any other questions, Yes. So let's do the last one from Benjamin Benjamin Beck. Incredible name. Is there no extra charge for the multi asset funds? What would be the benefits be? What would the benefit be to choosing the NPS over the multi asset fund? Okay. So with with pensions and ISS, alright, the the re the way it rebalances doesn't cause as much of an issue. Alright? I I I don't want you to in the whole reasons why, but so if if the client's in a pension and an ISA, rebalance within the NPS doesn't trigger a gain the same way it does in a GIA. Alright? So if you were if you're the client just for that came to you and older assets were in pensions and ISIS, then the NPS to me would probably be the best way to go. The reason being is, you know, it's coming in at fifteen, sixteen basis points, and why pay five bips extra for the exact same underlying holdings? Alright? However, what I would say on the flip side of that is there are some firms out there that like to still select their own multi asset funds instead of, you know, outsourcing it to a firm like Timeline or Pattern or whoever it may be. So by using an NPS, what you're doing is you're outsourcing us to select the underlying funds that that will produce the best outcome for your client. Alright? Whereas there are still firms out there that like to pick these underlying funds themselves. So that's that's another reason for us having the multi asset funds. I've already already hit on the the GIA. You know? It makes a lot of sense for the extra four, five basis points to not have the the rebalancing issues, that that can occur with MPS, and that's all MPS. Alright. But also as well, if you are a firm that like to select your own multi asset funds, then it obviously allows timeline to be part of that conversation. So they've you know? So for example, I've seen firms previously that, you know, select, you know, some with AJ Bell, some with Dimensional, some with Vanguard, and then can then be part of that conversation. So that's probably the two main areas where we see the multi asset fund being used. As I say, one, GIAs, and two, four firms that still like to select multi asset funds themselves and not outsource the whole process to provide a little time line. Cool. And then just one follow-up. But if the multi asset fund is cheaper but have the same investments, why go for NPS? No. Sorry if I wasn't clear there. So the NPS is is slightly cheaper. So NPS is let me just show that. So NPS, agent is client, nine basis points, plus the d f sorry, plus the OCF. So it's between fifteen and sixteen basis points. The multi asset fund is is twenty bps. So, I mean, there's not much in it. We're talking four, five basis points, so it's not it's not a huge difference in cost. Right. Hope the health Apologies if I'd ever worded that properly. There are any other questions. Of course, drop them in. We we'll get them answered. Should we continue? Let's continue. Perfect. So another another real strong point of our proposition, I'll be honest, this has improved massively in my time with with Timeline as we have our own investment analytics tool. It's powered by Morningstar, some input from FE. And one of the strong points is at Timeline, we operate what's called modular reporting. Alright? And what that means is we try and give you as much information as possible, and you can then select what you think will suit your incline or your business as best as it can. Alright? So what we have here, I'm gonna show you manage templates. Alright? So I'm gonna just create a new one, and I'm just gonna call it a b c just for speed. Alright? So you can then see, you know, when I'm analyzing investments, what do I want the report to show? Alright? So do I want it to show portfolio costs? I would almost certainly say yes. Do I want to show the number of securities? Do know what? I'll leave that and just for you know, how do I want the what you'll see here is each it it's showing you on the right hand side how the report the end report is gonna look. Alright? So do you want to show portfolio performance in a chart? Do you want to show the historic yield? I'm not gonna go through every single one, alright, just for just for speed purposes. Okay? But do you want to show top ten holdings? Yes. Alright. And all the way down so you can have as much or as little information in the report that you create. Alright? Now like our attack, there's one I've made earlier. Alright. So I have financial services. I just use this as my own template just for speed. So oh, actually, I'll come back here. So internal models, that's all time lines on multi asset funds NPS. Alright? External models, that is external NPS providers. If it's okay, I'm just gonna use TAN because I've mentioned them. We're the biggest players in the market. We are we are number three in the market. We are just went over at the end of June, fourteen and a half billion, in our NPS. So keep watching that space. Hopefully, one day we'll, we'll climb up to number one. But yeah. So, again, because we're discussing balanced, I'm gonna keep that in there. But externals, external NPS, and there's also multi asset funds. If it's okay, just to run a comparison, I'm just gonna select Vanguard's life strategy. It's probably one of the biggest competitors we come up against. It's probably the biggest multi asset fund range in the UK as well, so probably a good place to run a comparison. Model two is I'll run that against I'll run against both Timeline Tracker and timeline classic if that's alright. Again, if anybody wants to see any more in-depth analysis, again, please get in touch with your contact, which I will bring up at the end. Something I should mention mentioned as well is we also do have custom. So, for example, a firm that I was in discussion with yesterday had their own portfolios. So that allows them to build their own portfolios on our system. As long as you get the icing codes and the percentage and they feed more than the information through to Morningstar, you can create your own portfolios and call them, you know, Kelly Financial Services, your balanced sixty, whatever it may be. So, again, what you'll see here, please be patient with fetching data from Morningstar. Shouldn't take any more than ten seconds. Perfect. Thank you. Okay. So you may remember maybe about fifteen minutes ago, I said when I discussed transaction costs, but I will come back to them here. Alright. Now, of course, we have transaction costs. So there's five basis points here for the classic, five basis points here for the tracker. Okay? But not every provider details the transaction costs. Okay? So you'll see here Vanguard do. However, you'll see here that Tanton don't. Alright. So what our system allows to make sure you're comparing apples with apples is you can take away transaction costs and other costs if you wish. I'm gonna obviously, gonna leave the OCF in. But if you wanted to compare different costings, you can do that on the report. Alright? So I'm just gonna leave transaction costs in. Alright? But I just wanted to show that you can to make sure you compare like for like, take them away. Alright? So on the portfolio performance. Alright. So that shows one year, three years, five years. When it goes to all, that'll just go to, the longest running portfolio. You can also do custom as well. So say, for example, you wanted to see, you know, how the portfolio's performed, when COVID struck or the list trust mini budget or, you know, liberation date, whatever it may be, you can go in and and customize the dates. So, again, all that info that will pull through at the end report that we create. K? Obviously, making sure that we are comparing like for like in terms of equity content. You can look at the underlying the underlying holdings again because Vanguard's a multi asset fund. You can only see the one, but that would be the same. There will be underlying holdings within there. There's Tatons again, but everything's pretty much very, very close to the sixty percent equity holding. Which type of companies are held within it? So I mentioned earlier on that, the Timeline Classic has factor tilks away from large, you know, larger companies. So you'll see that here in these numbers. So, you know, large value companies, classic's holding fourteen percent. Tracker's holding twenty five percent. Compare the small cap. Trackers not getting any in small cap companies. We're actually looking at the time claim classic, having about ninety percent in there. So, again and you can compare that to Vanguard and also to Tetan. Where assets are held? So, again, I'm just gonna compare our own two portfolios if that's okay. But, you know, there's less in North America and the classic, the factor that was to be showed earlier on, more towards emerging markets. No surprises there. And Vanguard, as I'm sure most of you will aware, have a higher UK weighting, which again is pulling through on the report. You know, where it's held in terms of technology companies, of course, the tracker has more in there because it's tracking global market gaps as you would expect. Top ten holdings, and then performance is probably the most important part. But you could and just let you know as well, you can move that up the top if you wanted to. You can have it in any order that you want that to to be in. So, again, pull through the agent as client costing. We can do cumulative annualized calendar. And to be honest, my eyes are always drawn to five year annualized, whereas someone I spoke to yesterday said he prefers cumulative. So, again, personal preference there, but it will all pull through on the end. You can look at the volatility of the portfolios and their annualized performance. And the good thing is we can pull this through as report. We can also pull it through with a cover letter if you prefer. And as I mentioned earlier on, this end report can be in your branding, your colors, your logo, nothing to do with timeline. So I've obviously ran a comparison with timeline, but you actually don't have to do that. You could run this with Vanguard and Tatin. And the good thing is everything I'm showing here, comes as part of the the the DFM contract, the NPS contract. Alright? So I'm not going over this in extreme detail because I did just run over it, but, hopefully, you'll see one of the biggest feedbacks that we get here is that it is very client friendly to to read and understand, whereas you maybe pull through something that's more detailed from a fee, but it's maybe not the most client friendly to to read. And, of course, if you think this is pull through as twenty pages, if you view this as being too long, as I mentioned earlier on, you can go back and and and edit that and and make it a lot a lot less if that's what you prefer. Okay. Oops. Sorry. Yep. So another element of our ecosystem, alright, is that we have our own fact find risk profile and letter of authority tool. So I wanted to touch on this. The sharp eyed, you may notice that I'm a keen snooker fan. I even have a this is embarrassing. I've got a signed Stephen Henry snooker ball on my desk. Alright? So I don't actually know Stephen Henry. He's not a client of my own. I just thought I'd put that in there. Alright? So, Jay, so what we have is we have our own online, completely editable, digital, fact find. Alright? In my experience, I will show this in a minute, but I'm usually have three different variants of the fact. So we we have a default template that is sure it's one hundred and one, yeah, one hundred and one questions long. Alright? However, you can edit that to include as much or as little questions as you would like. K? So the three main fact things that I usually see, okay, is one, a very, very basic, you know, ten question fact finding, maybe fifteen question fact find that's for pre meeting pre first meeting. K? So you can send us to the client, you know, name, date of birth, health, basic information, all assets, team pay. Whatever it may be, you the key is you can edit it to what you want it to be. Because what I do hear from a lot of firms is sometimes they can have their time wasted with initial meetings. You know, one one firm in Leaf sticks out in my mind that someone came into the office for an initial meeting. I need five hundred pounds to invest in an. Alright. Of course, that meeting, you don't want the last one hour. So can you have a very basic fact find that can be completed pre first meeting? The next, that will be the more detailed. So, obviously, the one hundred and one questions. Again, that is the detailed fact find after the meeting. And, you know you know, we would need to know which pension providers you hold assets with, where your GIAs or or ISAs are held, you know, children, siblings, whatever information that you you want on that fact find, that can be there. And then the third one, that we see quite a lot is, again, pretty small ten, fifteen question, backfind that you can then send pre annual review. So, you know, any change in circumstances, change in job, change in health, inheritance, whatever that may be. But, again, it just gives you a lot of information before you sit down with the client. Now I will show you fact Okay? So you can start fact find here. Alright? Obviously, I'm not gonna start a full fact find. I just want to show you how the the system can operate it. Alright? So you can send a fact find directly to the client. Alright? That will come from the timeline system. Okay? Other option is you can generate a link to the fact find, which you can then email from your personal email not personal email address. Sorry. Your work email address. And the strong one of the strongest elements of this is it will email you when the client opens your email. It will email you when the client has started the fact find, and it'll email you instantaneously when the client has completed the fact find so you do not need to do the chasing. Also, strong point is if the client hasn't sent, or hasn't hasn't opened the fact find or hasn't completed the fact find or has started it and not got to the end, it will send reminders to the client. Alright. And the final one I just wanted to show here is if if you actually do still just prefer to sit down with a client and complete the fact find, that's fine. That's still an option. Or if maybe you think, you know, some clients would prefer one process, whereas another client would prefer another process, you can have a mixture of them all. It's whatever suits you and the company better. I I just want to touch on template as well just to show you the type of questions that do get asked. Alright? So, again, I'm not gonna go through each section. Alright? But what I will so when I said earlier on, so you can save this as, you know, annual review. Fact find. Alright. So you when I said earlier on, you can have the three. So you could have all three sitting there as a template ready to go, and you can make changes, you know, if and when you see fit as well. It's not like that has to be the set fact finding, then you create a brand new one from scratch. It's not the case. So just to show you, if there is a question that you don't want, obviously, you do want date of birth, I'm just trying to show you that you can you can take these questions away. If there is a question that you feel is not there, then you can add again, I'm not gonna type a question, but just for you can then change what type of answer. So do you want it to be a date? Do you want it to be money? Do you want it to be, you know, a text box? Again, all I'm trying to hit on here is that it is completely editable to what you and the business want it to be. We also have our own risk profiling tool. Alright. So this is twenty questions. You can start the risk profile up, and it has the exact same options that that you had with the fact. So you can send it to the client. You can generate a link, or you can sit and complete it with the client if you prefer. Thus, we you can edit these questions the way you can on the fact sheet. And then a tool that, to be honest, is getting loads and loads and loads of positive feedback. So you can see I use Steven as a as a dummy client every now and again because he's got a lot of outstanding, letter of authority. Okay? Again, I came from a big life provider, alright, as I mentioned at the start of the call. And without giving you the full at a workings, okay, there is different mailboxes for DB pensions, different mailboxes for workplace pensions, for personal pensions, for old legacy plans. And if you send if you send that email one via post or two to the wrong mailbox, it can go round in circles. So just wrong experience. I have chased many a letter of authority for advisers that that just don't know where that is. Alright. So this is your online digital letter of authority tool that works with PensionLab. Again, comes as part of the DFM contract. No additional cost to yourself or the firm. And I just wanna give you a quick overview of how it works in terms of sending, letter of authority. So, again, I'm a Timeline employee, so the firm details are obviously Timeline here. Okay? That wouldn't be the case for yourselves. That's not Stephen Henry's date of birth for it. I didn't go that deep into it. But what you can do here is so if you're looking for specific information, you can type there what you're looking for. So say it's garlic, so whatever it may be for old plants. You'd be amazed at how often this box was wrong in my previous life. Alright. So as a client wanting to change the service and therefore take on the ongoing fee, or are they just looking for information only? So key is then that isn't, that isn't, incorrect and hasn't been misread by the provider. And the good thing is here is you can add as many policies as you wish, and then we can send the ticket to the client to digitally sign. Alright. Now I'll do try and use a couple as an example here if that's okay. So just to show you, since I mentioned Royal London, I'll go Royal London again. Alright? So Royal London. I'll not go Willis Towers Watson. That'll blow the machine up. Okay. So and then the what the the report starts to give you feedback on each provider and how likely the process is to be accepted. Okay? So with Royal London, between fifty and eighty percent of the time, they'll be successful. Alright? And that's I would imagine that's slightly lower due to the amount of legacy plans that they have. Alright? Just going to use Scottish Widows as an example now. And to be honest, I know this is a good response. Okay? So over eighty percent of the digital letter authorities for this provider succeed. So, again, so you know you're not you're not one to be wasting your time. And then I am gonna pick one on the negative side. Okay? So Scottish Friendly, this provider doesn't support. So, you know, if it's a Willis Towers Watson, Scottish Friendly, or anybody that that insists it has to be a wait signature, whatever it may be, then the system, due to the amount of authorities that have been put through it, now has a pretty accurate success rate on who it's gonna work with and who you might be need to have to go down the the the the digital route. Alright. Oh, sorry. The the paper based route. Apologies. And then the final element of the ecosystem I wanted to just quickly touch on, alright, as our cash flow model. Alright? Now I need to be honest and say this would be an hour session on itself. Alright? So I'm not gonna go into all the the details of the cash flow modeler. Okay? Where I want to show you one of its strengths is is that it actually runs your client through the last one hundred and eleven years of history. So from nineteen fifteen to to the end of last year, we will run your client through every single scenario that's went on in the last one hundred and eleven years. So two world wars, great depression, COVID, dot com bubble. I could go on. Alright. I'll I'll I'll just keep listening. Tragic events have happened. Alright. But when past performance isn't an indicator of future performance, but also it's all we've got. So this is running your client through the last one hundred and eleven years of history. But another element that I just want to show here as well is, of course, we want the tool to be used for timeline portfolios and timeline multi asset funds as well. But as you'll see here, you can actually build in assets that the client holds not with timeline. It's not just a timeline tool to recommend and support timeline. The idea of your whole ecosystem is that it can be used for your business for every client regardless of their if they're a Timeline client or not. Oops. Sorry. I'll just click on that. Okay. Sorry. And you can also create reports on here. There are templates. So I mentioned earlier on that we'd be we run modular reporting. So, again, there's temp there's defaults here that we have. So default fact finds, default risk profile, and default switch reports, default financial planning tool. But as I mentioned earlier on, you don't have to use the defaults. You can make these reports as detailed or as little detailed as you wish. We leave that completely up to yourself. It was just two Jake, if it's okay. I just two small other points I was just gonna touch on if that's okay. So in terms of platform availability for the NPS and multi asset funds, as you'll see here, we're available in pretty much every single big platform that has couple smaller ones. We'll know. But I think it's twenty one, twenty two platforms that were available on. So please, if you do have any questions, please get in touch. And then the very final part that I was just going to mention is your regional BDM. So if you do have any questions that maybe I haven't answered or maybe I've flown past something a bit quicker than you would have liked, I'll not go over every single person and every single region. Alright? I'm obviously covering Scotland and Northern Ireland. Actually, something I will mention is it says here, well, church, south, west, and northeast. You might think he must need to split himself to different parts of the country. We have hired Steve Cooper to cover the northeast. He started on Monday. So anybody that is based up there, Steve will hopefully be in touch in the next couple of weeks. But, yeah, that's on our so just to show you how we got that, that's on the timeline website. If you go to contacts, that's where all that information is available. Perfect. Jake, that that was everything that I had. Incredible. Five minutes spare. That's great. No. Thank you for that. It was really, really good. We have two questions. I did actually have more, but I was conscious I had to leave five minutes at the end. So Yeah. We got we got some questions. It's always a good shout. That's okay. Look look. If you want more, get in contact. That that's the idea. That's that's the that's the key. Right? Send a message, book a demo, talk to us, and then we can provide you with everything that we that we have and that we can. So from Benjamin, we've got two questions. We'll do the easy one first. So can the fact find be downloaded as a PDF? What to then key itself? Yes. It can. Yeah. So if you just wanted to, like, write it with pen with the client. Cool. That's it. And now the the the this one, we might not have the info yet, but for the analytics tool, is there a plan to include more benchmarks such as mixed investments or flexible investments? Now we don't have a product guy on the call with us today. Yeah. So there are benchmarks on on it. But in terms of more detail, we don't have anybody from the product team. So that's just their own benchmarks. There are indices as well. Is there anything that you're looking for in particular out of curiosity? And on the back of that, Benjamin, why don't I just jump in? We are doing a whole session on analytics in August, so very soon. So if you you guys are anyone interested, wanna sign up for that as well, please do because I think we're gonna run through with that as well. But, yeah, Benjamin, anything in specifics? And if anyone else has got any further questions, please let us know. Or if you rather ask one, raise a hand, we can get you in to talk. So for the fact find, it was once input, sorry for the fact find, it was once input on the system to then download? No. So something actually I should have actually went in a bit more detail on. So once it's input onto the fact find as well, that automatically pulls through to all other systems and the timeline ecosystem. So for example, if a client has input that they've got a five hundred thousand pound pension, that'll automatically pull through onto the cash flow modeler. You as the adviser or paraplanner or administrator don't have to rekey that onto the system, though. So once the client digitally completes it, the only upset exception would be, of course, if you've done the PDF with the pen and paper, then you would need to complete it once. But once you've keyed it in that one time, it pulls through onto every other system. Great. So one thing one thing I actually I I didn't mention that I maybe should have as well was one thing that Timeline are very open to, alright, as feedback. So I mentioned this is far more detailed because advisers requested they wanted that in far more detail. So when I ran that analytics earlier on so you may have seen the section down the bottom that just do this very quickly. It should only take ten seconds. Perfect. Feedback from an a firm in Belfast. So we never used to have this export with a cover. It was just export to PDF and went straight into the report. A firm that I look after in Belfast came back to me and reported, Dan, we feel that should have a cover. I put it into the product team, and within a week, ten days, whatever it was, we produced the the option now because we we've had some feedback from other forums that we they they didn't like the cover. So we then went ahead to but now we have the option. So that's one thing I would say about timeline is if we don't have it right now, as long as we feel there's a a big overall benefit to the adviser world, if that makes sense, you know, if it's something quite quite obscure, like a question or or or something, Maybe not. But if it's, you know, something that overall client you know, the vast majority of the UK financial adviser industry would benefit from, then please put the idea forward, and you'd be amazed at how often we put it in the development pipeline. And, you know, one, two, three months later, whatever it may be, we then start doing it. God, I think I could second that more. Very, very true. So I think that's it. I think that's it, guys. Thank you very much for joining. You're gonna receive this recording, of course, like always. You're gonna receive more information, so look out for that. That should be coming within the next few days at all. Brian says very good, Dan. Thank you. And I think everyone in the room, I appreciate that as well, Dan. That was incredible, an incredible thing. So get in contact with Dan or your regional representatives if you want any more info or their support with timeline as well. But I think anything left to to say, Dan? No. No. Thank you for coming along, and enjoy the sun. Yeah. Yeah. Enjoy the sun. That's a pretty good time. Yeah. Enjoy the sun, everybody. Thank you very much, Graham. We appreciate it. See you on the next one. Take care, all. Thank you. Bye.
A guided demo of Timeline’s investment solutions, technology and adviser-first processes.
Multi-Asset Fund or MPS? A Practical Guide to Choosing the Right Solution
The Timeline Charts 2026 now available
Timeline Is Building a Smarter Advice Ecosystem for Financial Planners
Find out how Timeline Platform removes friction across the entire client journey
How Pennee works seamlessly acress the tools you use everyday
Research & opinions to
Inform your thinking

A podcast of unfiltered gold
released every week

Tech developments that
help you thrive
Chris Palmer
Hansford Bell
Sarah Steele
Yellowtall Financıal Planning
Ross Biddiss
Hansford Bell
Save time, achieve better outcomes and grow your practice with support you can trust.

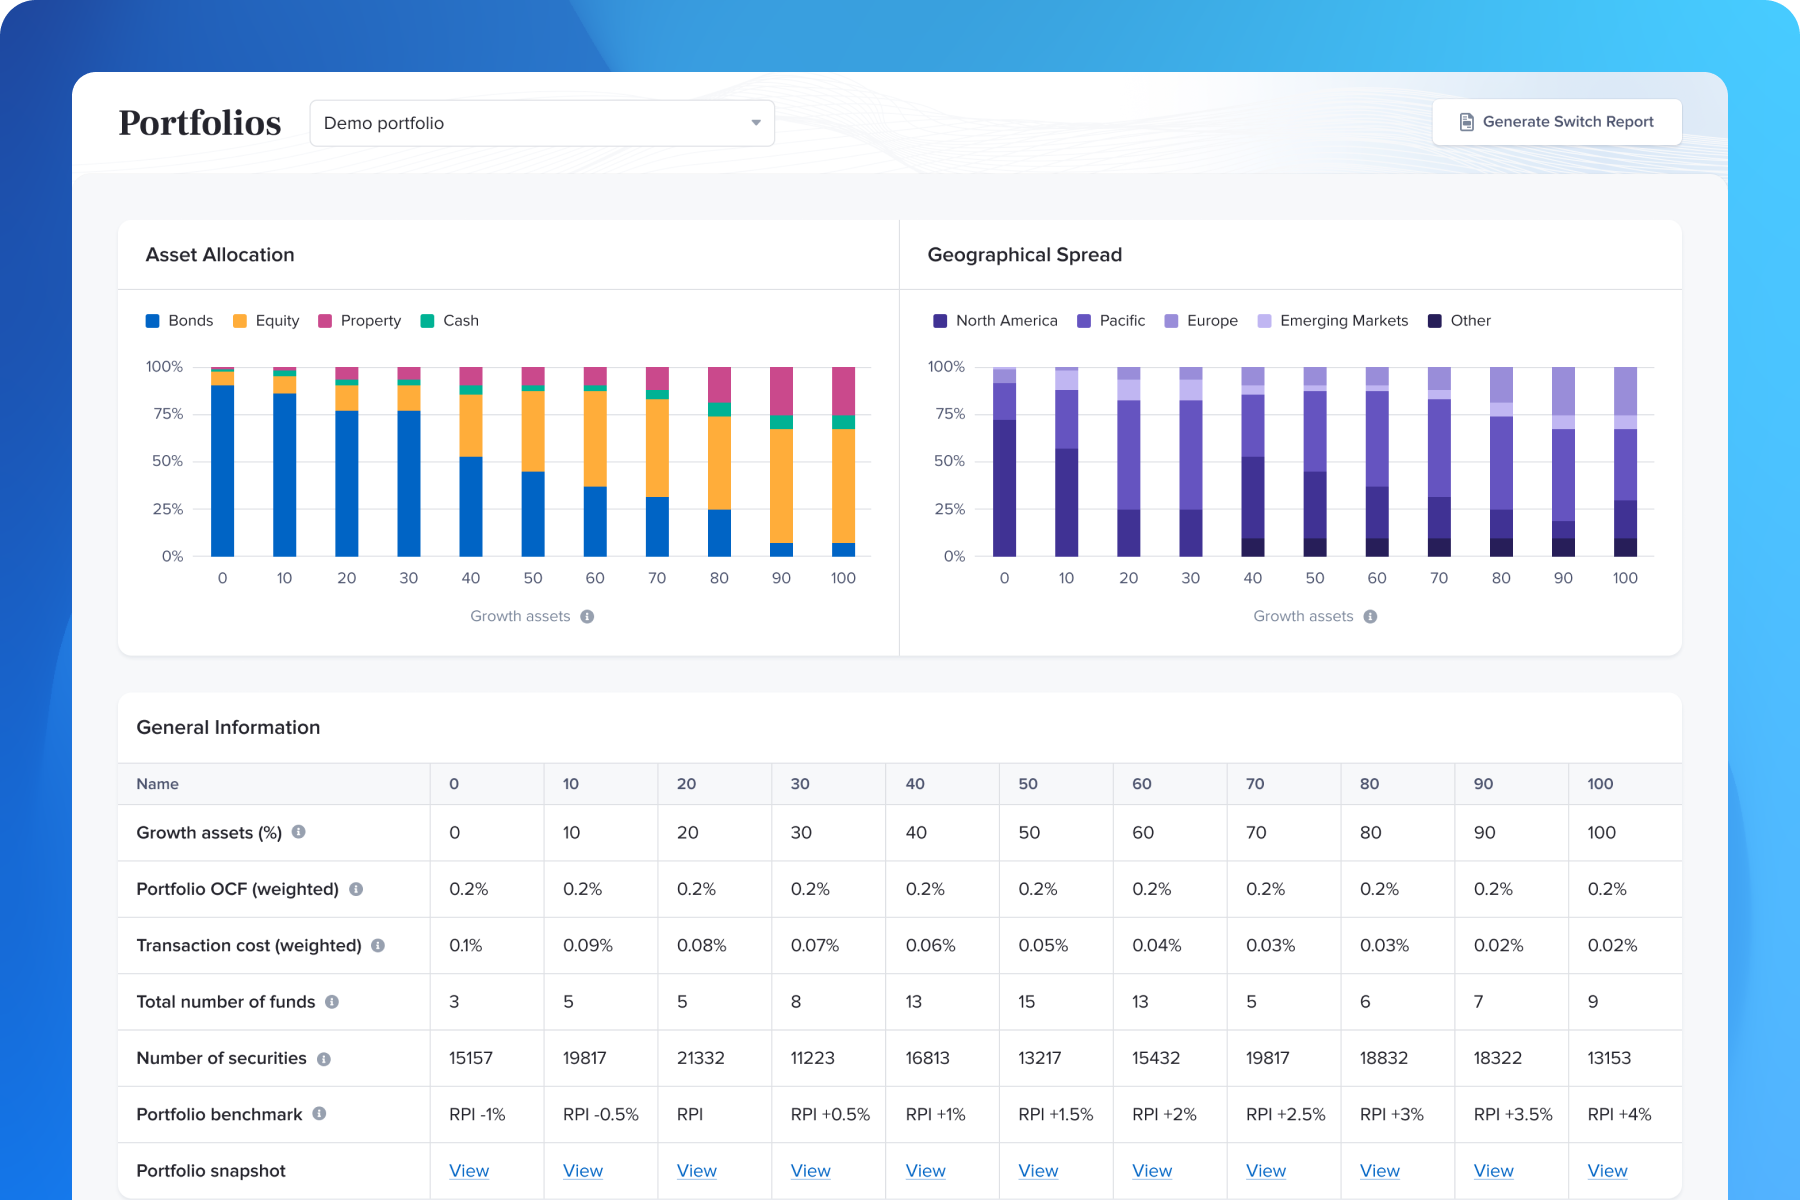
You’ll discover our range of portfolio options, from low-cost Tracker portfolios to globally diversified Classic portfolios, all built to target long-term growth while managing risk in a disciplined, transparent way.
We’ll also take you behind the scenes of our tech stack, showing how Timeline helps you streamline onboarding with automated LOAs, stay compliant with integrated KYC/AML, and compare or optimise financial plans - all from one seamless platform.
If you want the full picture of what it’s like to invest with Timeline - and how our tools are designed to make your life easier - this is the tour for you.
A live webinar that brings together all our latest updates with a seamless tour of our fantastic investment offering.
April
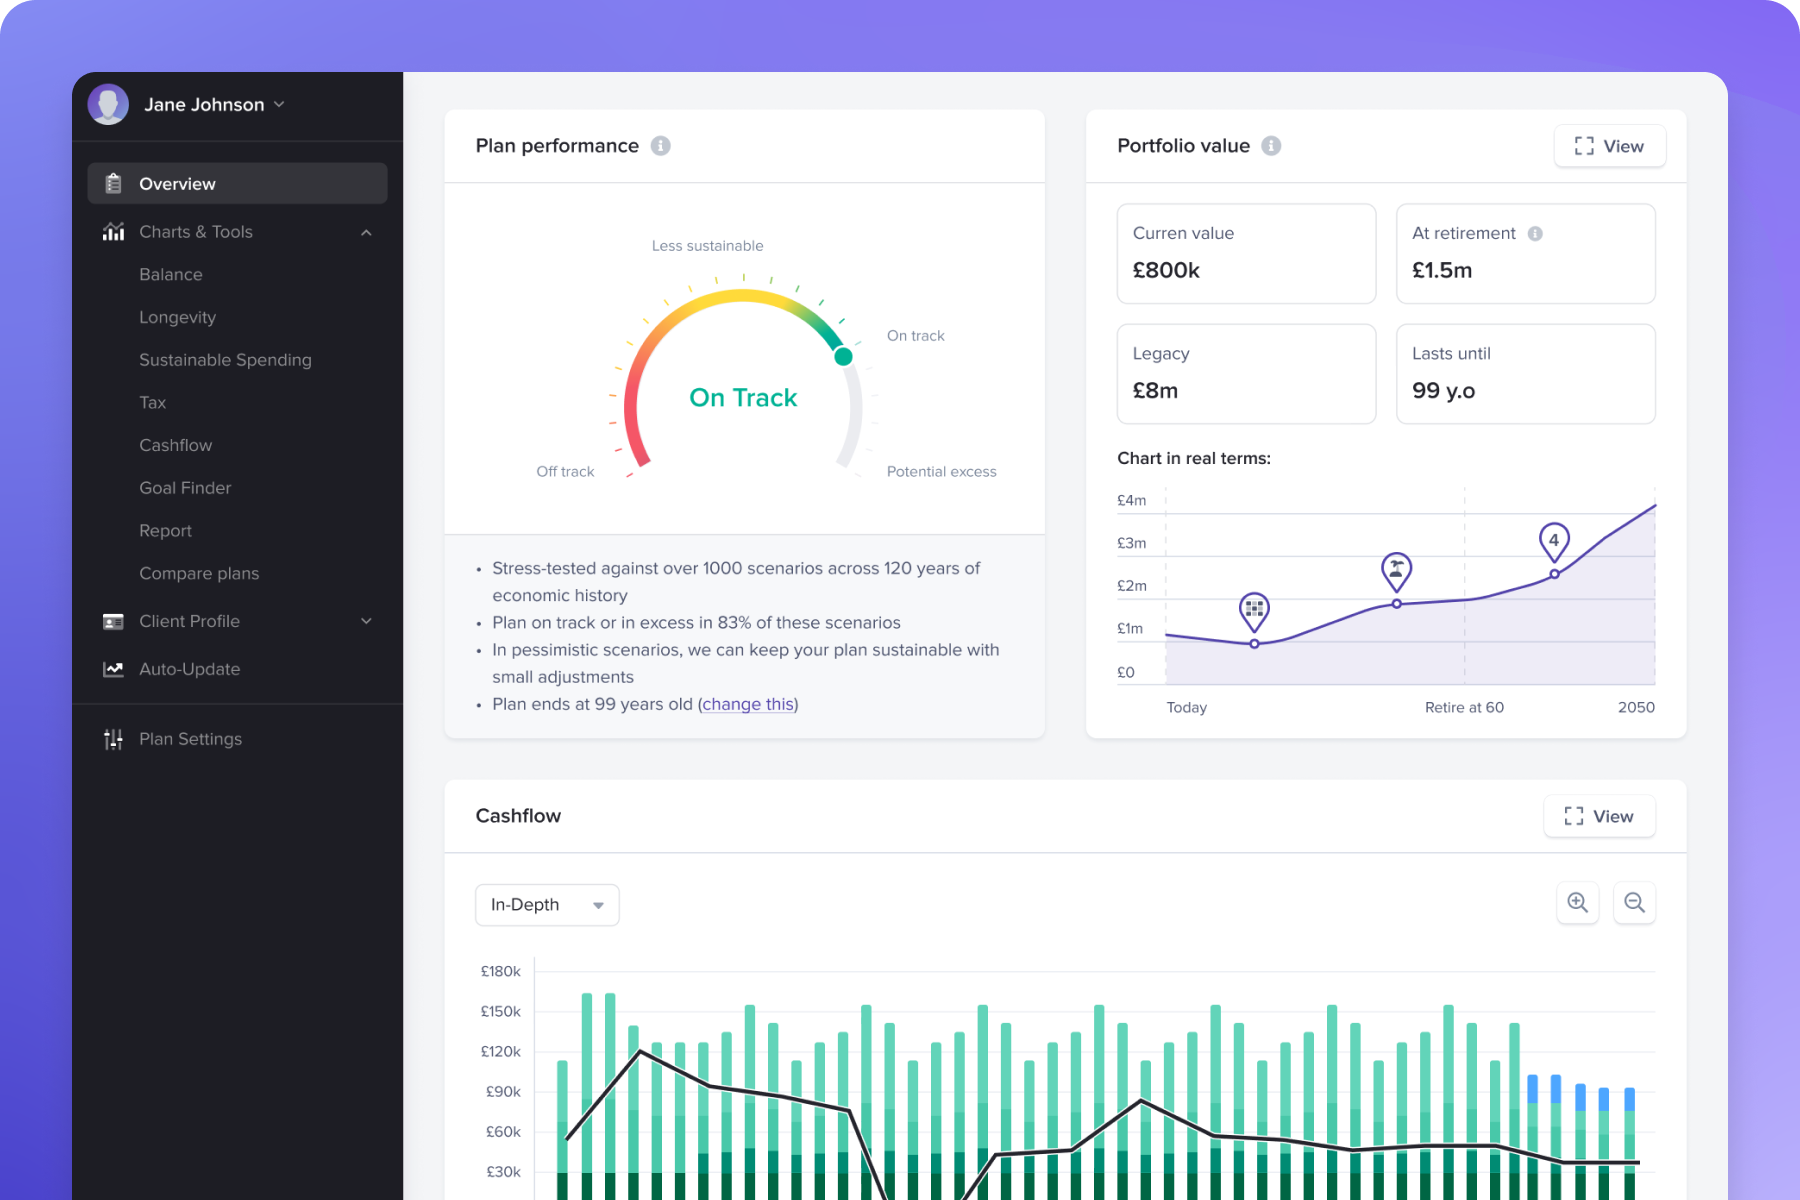
We make financial planning easier for advisers and more engaging for clients. Financial Advisers add the most value to clients through personalised plans and coaching that gives clients clarity and confidence in their financial future. Hear the direct feedback from advisers and firms who have reaped the benefits of working with us.