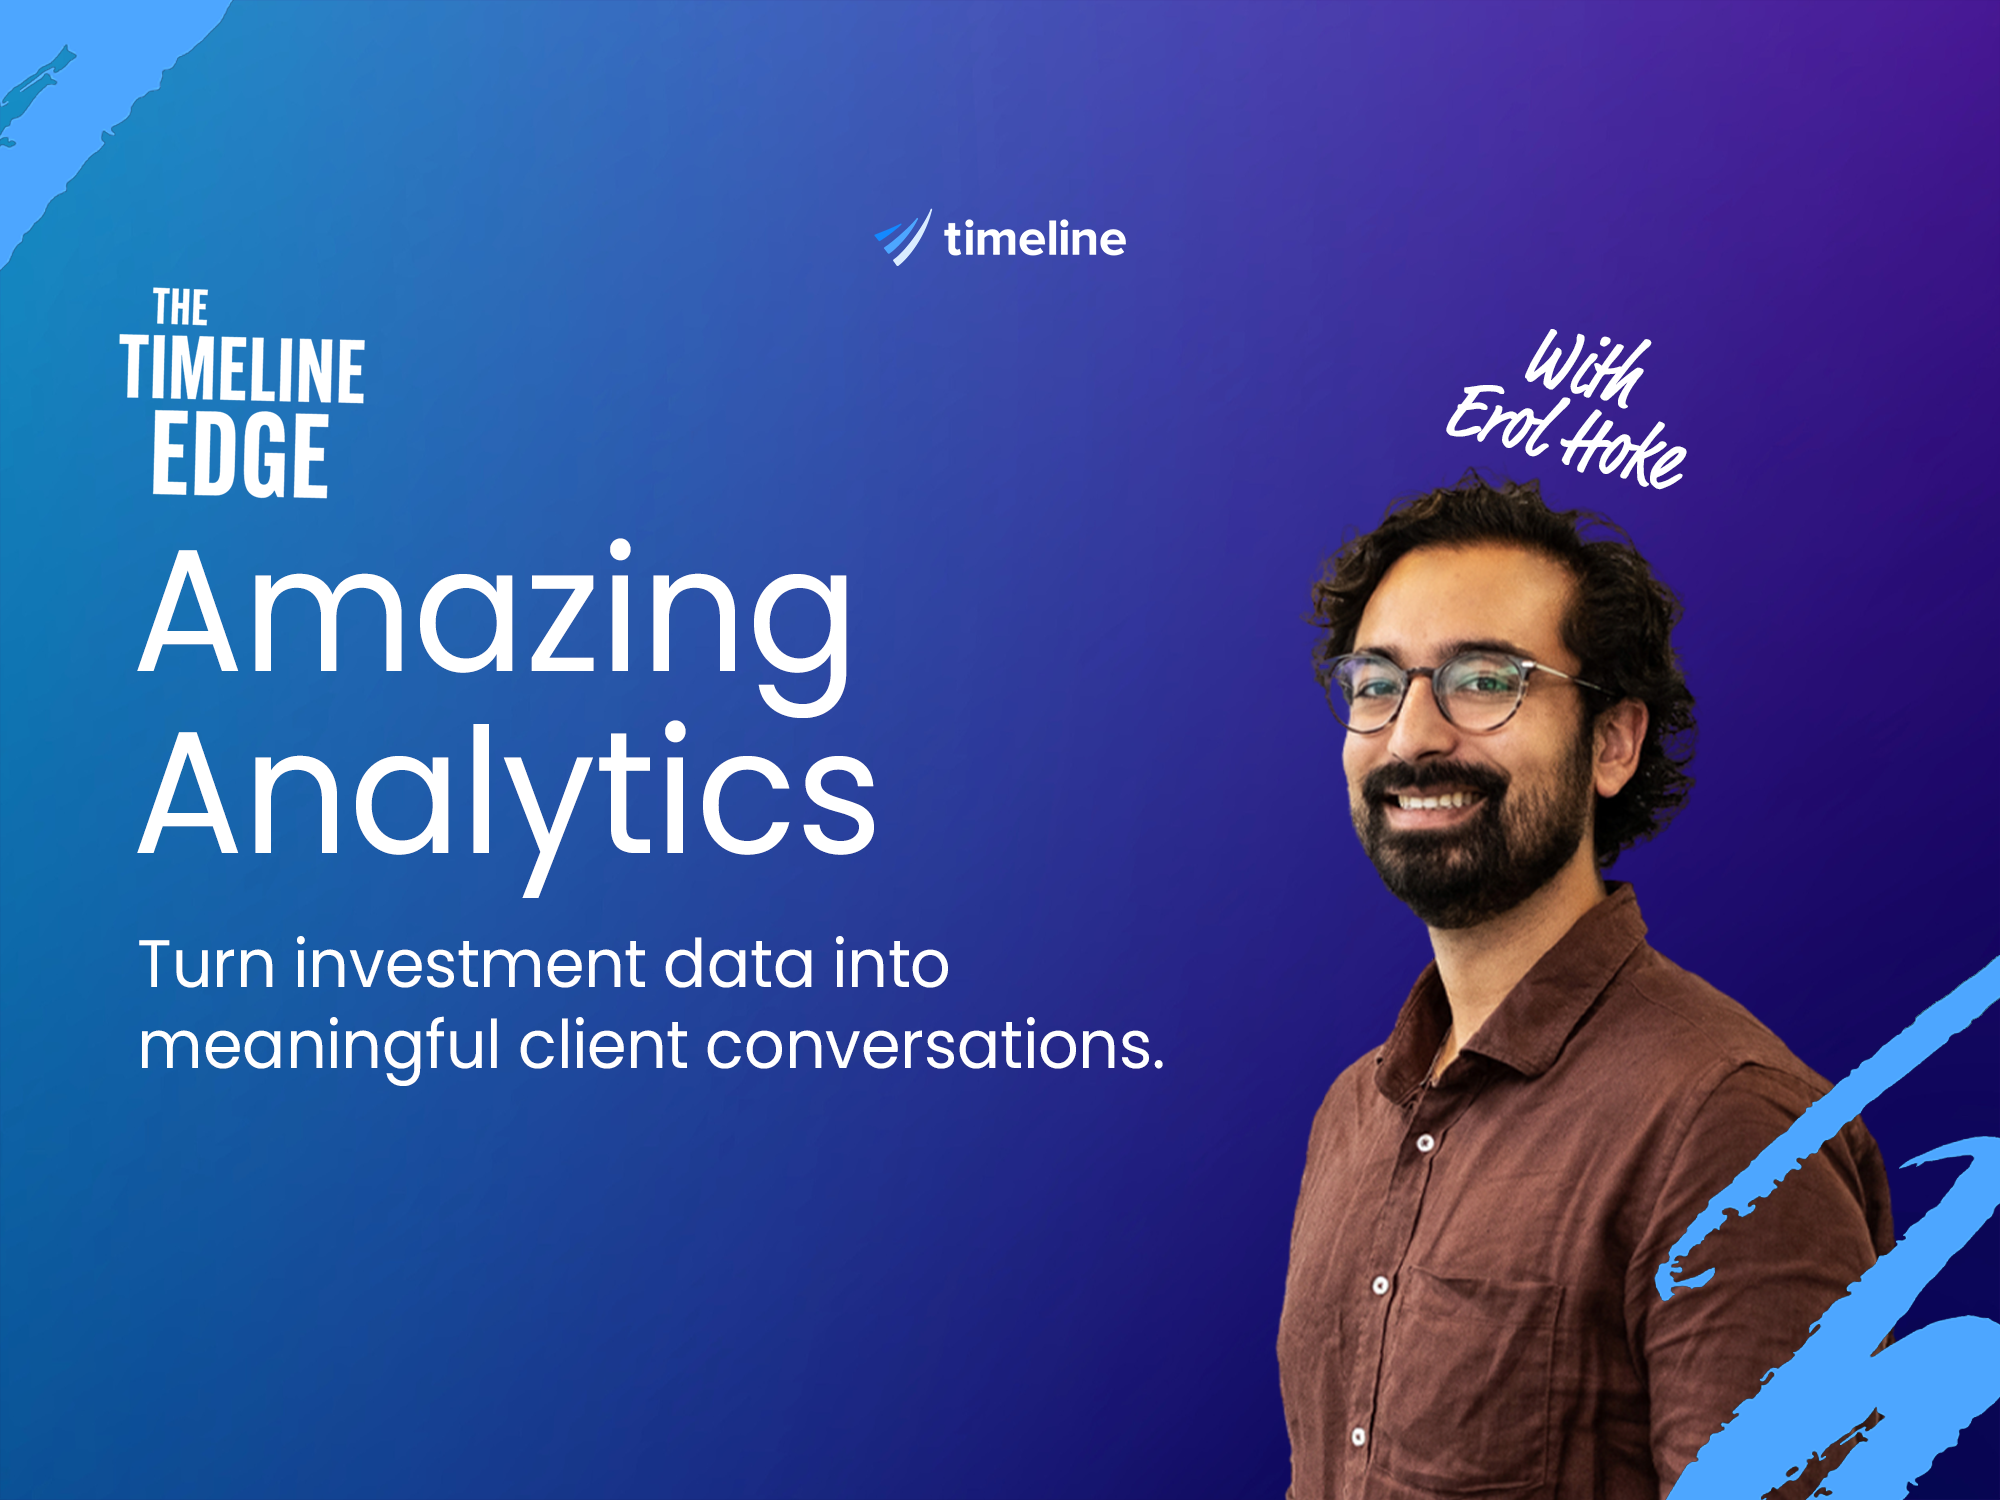
Our latest session gave advisers a hands-on tour of the revamped Analytics tool: a single place to compare investments, build client-ready reports, and carry out deeper investment research without hopping between third-party sites. Erol Hoke, our Product Manager, walked attendees through how a saved workspace, broad data coverage and one-click export come together to take the manual work out of investment comparisons.
The walkthrough moved through four live demos: building your own reporting workspace, handling complex client cases with custom portfolios, going deeper for investment research, and a first look at asking for analysis in plain English through Pennee. Questions were answered throughout, and there was a quick look at ESG at the end.
You can watch the full recording of this session over on Wistia. The links at the foot of this page will take you deeper into Timeline Analytics or let you book a live demo.
Watch the recordingPut up to six portfolios side by side, rather than one or two at a time.
Save a workspace with the charts you want, then just pick the investments to compare.
Export a single chart or the whole report, ready for a meeting, a report, or an email.
New: request the analysis you want through Pennee, our AI assistant (currently in beta).
Internal models, custom portfolios, indices, inflation benchmarks, multi-asset funds and external models.
Toggle fees on or off for like-for-like comparisons, and add platform and advice fees when needed.
Why We Rebuilt Analytics
Analytics began as a set of internal tools. Timeline built them to run its own rebalancing methodology and performance tracking for its managed portfolio service, because many tools on the market were not calculating performance the way the team felt best represented it. Those tools turned out to be useful well beyond internal use, from comparing investments to demonstrating suitability for clients, so they were opened up to advisers. Earlier this year the tool had a major revamp: far more customisable, with new charts and new features.
The old way of working was familiar to most advisers in the room. Pulling charts down from several third-party tools, dropping them into a Word document, and formatting by hand. Screenshotting individual tables and fact-sheet lines to compile one comprehensible document. Trying to remember which benchmark, date range, or fee assumption was used last time. It was a process that had to be repeated from scratch for every client, and it added little value each time.
"We've stopped using [other tools] in favour of the charts Timeline produce, because it's quicker, and it's better."
An adviser, on switching to Timeline Analytics
Demo 1: Build Your Own Reporting Workspace
Analytics now lives in the top navigation bar of the Timeline app. Erol started from the standard default dashboard, then showed how to make it your own. To run a comparison you simply select the investments you want to see, grouped into categories to make searching faster: internal models (Timeline managed portfolios), custom portfolios, indices from Morningstar, inflation benchmarks, multi-asset funds, and external model portfolios. Charts and data appear immediately, ready to customise.
Every chart can be exported as an image, or the underlying data can be exported as CSV. The performance chart pulls the longest history available by default, then lets you set any date range that is relevant, for example from the point a client first invested. Alongside performance you can look at income yield, portfolio allocation, underlying fund holdings, equity holding breakdowns, style boxes, regional diversification, and bond data, with a single click producing a PDF export to share.
The biggest change is that the default is no longer the requirement. Using dashboard templates, advisers can build as many saved layouts as they like, each with the charts they want in the order they want. One template might be a simple, client-facing view focused on performance and costs. Another might carry more detail for a more questioning client, or for internal use. There is also a new chart for anyone who uses the Timeline risk profiler: it automatically scores a custom portfolio, multi-asset fund, or external portfolio against the Timeline risk methodology, so you can see how a holding compares to a client's risk profile.
Demo 2: Complex Client Cases With Custom Portfolios
When a client arrives with a grab bag of self-managed funds, custom portfolios let you track exactly what they hold and how it has changed. You give the portfolio a name, choose a rebalancing method, then paste ISINs and allocations straight from Excel; funds populate automatically with their OCF costs and weightings. You can also add holdings manually by ISIN or Citicode, or by writing in cash.
Once saved, a custom portfolio runs from the first date all its funds have data, and you can move the start date to match when a client actually invested. Because portfolios rarely stay static, portfolio updates let you record changes over time: swap a fund, adjust weightings, or model a rebalance as of a given date, and performance tracking uses the right allocation for each period. Custom portfolios are then available across the ecosystem, including in financial planning and modular suitability reporting, and the portfolio centre lists a Timeline risk score for each one at a glance.
Long-standing analytics users worried about losing historical advisory portfolios can export from the old analytics and re-upload to recreate them. For larger migrations, Erol pointed advisers to their adviser success manager for hands-on help with setup and data transfer.
Demo 3: Go Deep For Investment Research
The same tool doubles as an investment research workbench, for example when managing a centralised investment proposition or weighing up providers. Erol built a Technical Investment Analysis dashboard closer to what Timeline's own investment team uses: portfolio performance in percentage terms, returns and volatility comparisons, style boxes to show concentration, bond characteristics such as coupon and duration, costs, income yield, and bond quality, plus tables that make the numbers easy to read.
Comparing a more aggressive proposition, he lined up Timeline options against a competitor and a Morningstar moderately adventurous benchmark, then added an inflation-plus target such as RPI plus 3 per cent. Transaction costs can be removed where they are not relevant, comparisons can be viewed pairwise, and any time period can be applied. The returns and volatility scatter uses a five-year window by default and segments portfolios by risk-adjusted return, making it easy to see which options are leading and which are lagging.
Demo 4: Just Ask Pennee
The final demo previewed Pennee, our AI assistant, now beginning to connect to Analytics. Pennee is a chatbot you speak to in natural language, but the outputs are the same high-quality, deterministic data used everywhere else in the tool. Ask it to run a comparison and it interprets the request, and when something does not match your data, for example a client it cannot find, it stops and asks rather than guessing.
In the demo, Pennee printed charts one at a time from a saved template, added a performance table on request, pulled in a sector breakdown, and re-ran a comparison with an added RPI plus 3 per cent benchmark, all through plain prompts. A very new feature lets Pennee redraw data in different formats, for example turning a performance table into a column or line chart, or a sector breakdown into pie charts, with everything still exportable to PDF, PNG or CSV.
Please note: Pennee is in beta and is not yet generally available. Advisers keen to try it should speak to their sales or adviser success manager. Erol also noted that Pennee is reliable for retrieving and reformatting data, while calculation and recalculation features are still being refined.
A Quick Look At ESG
By request, Erol gave a brief tour of the ESG analysis feature. It takes a custom or internal portfolio, pulls data from Morningstar, and shows overall ESG risk with more detailed breakdowns. It currently works from existing portfolios into Timeline portfolios. Timeline is planning to expand and improve it, and a dedicated session on ESG may follow.
Questions From Advisers
Can the data feed be improved? Morningstar is the main provider. Some older or less-regulated asset managers share less data, which limits coverage. Timeline is exploring direct extraction from fact sheets, with larger data features expected in the coming months.
Does the number of holdings double-count stocks across funds? This was fixed roughly three months ago. Holdings are now deduplicated as far as look-through data allows, most reliably for internal, custom and external model portfolios.
Are performance reports net of adviser and platform charges? Not on the performance chart itself. Adviser and platform fees can be added to the portfolio cost chart.
Where do the fund and benchmark data come from? Inflation figures (CPI and RPI) come from the Office for National Statistics, updated monthly with a short lag. Indices are Morningstar benchmarks designed to align with well-known market indices.
Can I get monthly performance data in CSV? Daily performance can be downloaded to CSV today. There is no dedicated monthly export yet, though more custom exports and Pennee-assisted extraction are on the roadmap.
Further questions were answered live, including comparing against an assumed cash-flow return, adjusting the scatter-chart timeframe, building portfolios from pension statements, and blending managed portfolios. If any of these are relevant to your practice, speak to your adviser success manager.
See It For Yourself
If you would like a closer look at how Analytics fits into your research and reporting workflow, the links below will take you deeper into Timeline or let you book a one-to-one walkthrough with our team whenever it suits you.