.png)
Timeline's ESG portfolios are designed to align with our broader investment philosophy of maintaining low-cost, globally diversified portfolios whilst incorporating environmental, social and governance considerations. Consistent with our evidence-based approach, we do not view ESG as a separate asset class or a source of guaranteed outperformance. Instead, ESG provides an additional perspective through which potential risks and opportunities can be assessed.
Our approach is deliberately pragmatic. Whilst sustainability considerations are incorporated into the portfolios, diversification, cost efficiency and long-term investment outcomes remain the primary objectives. The aim is not to maximise ESG scores at any cost, but to enhance the sustainability profile of the portfolios in a practical and evidence-based manner whilst remaining aligned with Timeline's core investment philosophy. Importantly, Timeline primarily views ESG through a risk lens. Environmental, social and governance issues can have a meaningful impact on long-term company performance through factors such as regulatory costs, litigation, reputational damage and operational disruption. As a result, ESG factors are considered alongside traditional financial risks when assessing portfolio construction and fund selection.
Timeline's ESG approach combines three key elements: exclusions, positive selection and stewardship. Together, these approaches seek to reduce exposure to selected ESG risks, improve portfolio sustainability characteristics and encourage positive corporate behaviour through active ownership.
Exclusions
The first element of our approach is exclusions. The funds used within the ESG Classic and ESG Tracker ranges seek to limit exposure to activities that are commonly associated with higher ESG risks, or that may be inconsistent with the preferences of many ESG investors. Depending on the methodology of each fund, this may involve full exclusions or revenue-based thresholds.
Examples include controversial weapons, tobacco production, thermal coal, fossil fuel expansion activities, severe ESG controversies and companies that breach internationally recognised standards such as the United Nations Global Compact. These screens aim to reduce exposure to activities that many investors associate with elevated environmental, social or reputational risks.
Why Don't We Screen All Product Involvements?
A common question is why ESG portfolios do not simply exclude every activity that some investors may find undesirable. Whilst broader exclusions may appear attractive in principle, increasingly restrictive screening can significantly reduce the investable universe, leading to lower diversification and increasing concentration risk.
Timeline, therefore, adopts a pragmatic approach. We focus on exclusions that are widely recognised across the industry, such as controversial weapons, tobacco, thermal coal, severe ESG controversies and breaches of international norms. Beyond these areas, we generally favour a combination of positive selection and stewardship rather than blanket exclusions.
This approach recognises that companies within the same sector can have very different ESG characteristics and that meaningful improvements can often be achieved through engagement and active ownership. It also reflects our broader investment philosophy of maintaining diversified portfolios while seeking to improve overall sustainability characteristics.
It is also important to recognise that ESG data providers do not always agree on how companies should be classified. As a result, small residual exposures may sometimes appear within third-party datasets despite the presence of screening policies. In many cases, these differences reflect variations in definitions, data sources and classification methodologies rather than a failure of the underlying screen.
Positive Selection
Alongside exclusions, the funds seek to increase exposure to companies demonstrating stronger ESG characteristics. Rather than excluding entire sectors, many ESG strategies assess companies using a range of environmental, social and governance measures, including carbon emissions, resource efficiency, workforce management and corporate governance practices.
Companies with stronger sustainability credentials may receive higher portfolio weights than peers with weaker ESG profiles. This approach seeks to improve the overall ESG characteristics of the portfolio while retaining exposure to a broad range of sectors and companies. It also recognises that sustainability characteristics often exist on a spectrum rather than as a simple pass or fail assessment. On environmental issues, many of the underlying strategies seek to reduce carbon-related risks and emissions intensity while maintaining diversification.
Responsible investing exists on a spectrum, with different approaches placing varying levels of emphasis on ESG objectives.
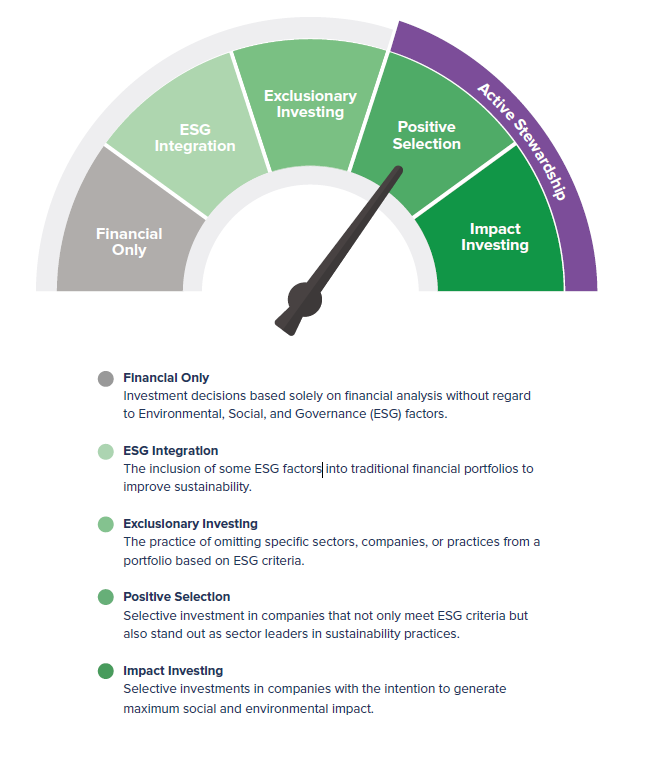
Source: Timeline (2026)
Climate Action: A Focus on Carbon Emissions
Climate change is one of the most significant environmental challenges facing investors. Whilst some ESG strategies focus primarily on excluding fossil fuel companies, Timeline's approach places greater emphasis on reducing carbon emissions intensity, a recognised metric for measuring greenhouse gas emissions, which are widely established as the primary driver of climate change.
This distinction is important because not all fossil fuel companies have the same carbon profile, and excluding entire sectors does not necessarily result in the greatest reduction in portfolio emissions. By focusing on carbon intensity, the underlying strategies seek to reduce exposure to the primary driver of climate change whilst maintaining broad market diversification.
As a result, the ESG portfolios target substantially lower carbon emissions intensity than broad market benchmarks while continuing to provide diversified exposure across global equity and fixed income markets.
Broad fossil fuel divestment can also have unintended effects. Selling these holdings simply transfers ownership to other investors. On its own, it does not reduce the emissions a company produces. It may also remove the investor voice that can press for credible transition plans. By targeting carbon intensity and supporting engagement, the underlying strategies focus on the primary driver of climate risk while retaining the ability to influence corporate behaviour.
Stewardship and Engagement
The final element of our approach is stewardship. As long-term investors, we believe stewardship can play an important role in supporting resilient businesses, stronger governance standards and sustainable long-term investment outcomes. Through the underlying managers in the portfolios, investors can seek to influence corporate behaviour through engagement, voting, and, where appropriate, escalation activities.
Stewardship may involve engaging with companies on issues such as climate-related risks, governance standards, board effectiveness, human capital management, biodiversity and business conduct. Managers can also use their voting rights to support or challenge company proposals where they believe changes may improve long-term shareholder outcomes. This recognises that, in some cases, remaining invested and engaging with companies can be a more effective way of encouraging improvement than simply excluding them from a portfolio.
As Timeline does not engage directly with investee companies, stewardship is primarily delivered through the underlying fund managers selected within our portfolios. As part of our due diligence and ongoing monitoring process, we assess managers' stewardship capabilities, including their engagement activities, voting practices and broader ESG integration. We look for managers who treat stewardship as an integral part of their investment process, clearly disclose voting records and engagement outcomes, and demonstrate how material issues are prioritised and escalated where necessary. We place particular emphasis on evidence of tangible engagement outcomes rather than simply reporting activity. Collaborative engagement and escalation tools, such as voting against directors or supporting shareholder resolutions, can strengthen investor influence where progress is limited.
Together, exclusions, positive selection and stewardship form the foundation of Timeline's ESG approach. The following analysis examines how these principles are reflected within the ESG Classic and ESG Tracker portfolios through product involvement screens, ESG risk scores and carbon-related metrics.
Understanding the ESG Metrics
The ESG metrics used in this report are intended to provide insight into the environmental, social and governance characteristics of portfolios. Rather than measuring whether a company is inherently "good" or "bad", these metrics seek to identify potential risks that could affect long-term business performance and shareholder outcomes.
The ESG Risk Scores used throughout this report are sourced from Sustainalytics and reported via Morningstar Direct. These scores measure a company's level of unmanaged ESG risk. In simple terms, this means the ESG risk a company is exposed to after considering how much of that risk is being managed through policies, governance structures, controls and business practices. Lower scores indicate lower levels of unmanaged ESG risk and are therefore generally considered more favourable.
The scores are grouped into three pillars:
- Environmental (E): Covers issues such as carbon emissions, resource use, pollution, waste management and environmental practices.
- Social (S): Covers labour practices, employee welfare, product safety, human rights, customer relations and broader stakeholder impacts.
- Governance (G): Covers board quality, shareholder rights, executive remuneration, business ethics and corporate oversight.
At the company level, Sustainalytics assesses the ESG issues considered financially material to a company's industry and business model. This includes evaluating the company's exposure to those risks and how effectively they are managed. The remaining risk is referred to as unmanaged ESG risk and forms the basis of the ESG Risk Score.
At the portfolio level, the scores are calculated by aggregating the scores of the underlying holdings and weighting them according to their position size within the portfolio. As a result, larger holdings have a greater influence on the overall portfolio score than smaller holdings. Where holdings are not covered by the corporate ESG risk framework, such as certain sovereign bond exposures, this should be treated as a data coverage limitation rather than an indication that the exposure carries no ESG risk.
|
ESG Risk Score |
Risk Category |
Interpretation |
|
0.0 - 9.99 |
Negligible |
Negligible unmanaged ESG risk |
|
10.0 - 19.99 |
Low |
Low unmanaged ESG risk |
|
20.0 - 29.99 |
Medium |
Moderate unmanaged ESG risk |
|
30.0 - 39.99 |
High |
High unmanaged ESG risk |
|
40.0+ |
Severe |
Severe unmanaged ESG risk |
Source: Morningstar
Carbon Metrics
Alongside ESG Risk Scores, this report also considers carbon-related metrics. Climate change is one of the most widely recognised environmental risks facing investors, and carbon metrics provide a useful way of assessing both a portfolio's carbon footprint and its exposure to climate-related risks.
Weighted Average Carbon Intensity (WACI)
Weighted Average Carbon Intensity (WACI) measures the carbon efficiency of portfolio holdings by comparing greenhouse gas emissions with company revenues. It is calculated using Scope 1 and Scope 2 emissions and is expressed as tonnes of carbon dioxide equivalent (CO₂e) per US$ million of revenue.
WACI is calculated by taking each holding's carbon intensity and weighting it according to its position size within the portfolio. A lower WACI indicates that, on average, portfolio holdings generate fewer emissions relative to the revenues they produce. WACI is widely used across the investment industry and provides a standardised way of comparing carbon exposure across portfolios.
Carbon Risk Score
Whilst WACI focuses on emissions, the Carbon Risk Score seeks to measure the financial risks associated with the transition to a lower-carbon economy. The score is based on Sustainalytics research and assesses both a company's exposure to carbon-related risks and how effectively those risks are being managed.
The assessment considers risks arising from a company's own operations, the carbon intensity of its products and services, and, where relevant, carbon-related risks associated with lending, investment and financing activities. Companies with stronger governance, transition plans and risk management practices may achieve lower Carbon Risk Scores even if they operate in carbon-intensive industries.
The Carbon Risk Score, therefore, measures unmanaged carbon-related financial risk rather than carbon emissions alone. Lower scores indicate lower exposure to carbon-related risks that could arise from regulation, technological change, changing consumer preferences and the transition to a lower carbon economy.
Fossil Fuel Exposure
Fossil fuel exposure measures the portfolio-weighted percentage of assets invested in companies that derive revenue from fossil fuel-related activities.
Two measures are commonly reported. Any involvement captures companies with any identified revenue exposure to fossil fuel activities, whilst majority involvement focuses on companies that derive more than 50% of their revenue from fossil fuel products or services. As a result, majority involvement figures are typically lower than broader fossil fuel exposure measures.
Fossil fuel exposure provides an indication of a portfolio's participation in carbon-intensive industries, whilst Carbon Risk Scores provide a broader assessment of how exposed those companies may be to climate transition risks and how effectively those risks are being managed.
Taken together, ESG Risk Scores, Carbon Risk Scores, WACI and Fossil Fuel Exposure provide a more complete picture of a portfolio's sustainability characteristics. Whilst no single metric can fully capture every aspect of ESG risk, using a combination of measures helps provide a broader understanding of potential environmental, social and governance risks within a portfolio and how those risks compare with broader market benchmarks.
Product Involvement
Product involvement measures the percentage of a portfolio invested in companies that are classified as having revenue exposure to specific products, services or business activities. Examples include tobacco, controversial weapons, alcohol, gambling, thermal coal and fossil fuel-related activities. The figures, therefore, represent portfolio exposure to companies with involvement in a given activity, rather than the proportion of portfolio revenue derived from that activity.
These figures are portfolio weighted and based on Morningstar/Sustainalytics business involvement classifications. They should not be interpreted as the percentage of portfolio revenue generated from that activity. Instead, they show the proportion of holdings that have been identified as having some involvement in the relevant activity.
It is also important to distinguish between product involvement data and exclusion screens. Product involvement data identifies exposure based on third-party classifications. Exclusion screens show whether an underlying fund applies a screen to that activity. These screens may be full exclusions, partial exclusions or revenue threshold-based exclusions, depending on the fund methodology. As a result, small residual exposures may still appear even where screens are in place.
Absolute and norms-based exclusions
Certain categories, including controversial weapons, nuclear weapons, and UNGC or norms violators, are screened on a full or norms basis rather than via a revenue threshold. For these, any residual exposure shown in third-party datasets reflects a difference in classification rather than a deliberate tolerance. Such differences can arise in several ways: data providers may apply broader or narrower definitions of involvement, draw the boundary between related categories differently (for example, between controversial weapons and nuclear weapons), or differ in how and when they judge a company to have breached an international norm. As a result, a holding captured under Morningstar/Sustainalytics' classification may appear as residual involvement even though it sits outside the underlying fund's own screen. Where this occurs, we flag the exposure and take it up with the relevant fund manager to confirm that no violation is present against their own screening provider. We have, however, chosen to report consistently on a Morningstar basis, and therefore continue to show the full, unedited exposure as reflected by Morningstar rather than adjusting it to the manager's classification.
Morningstar Sustainability Globe Ratings
Morningstar's Sustainability Globe Rating assesses how well a fund manages Environmental, Social and Governance (ESG) risks relative to other funds within the same Morningstar category. The rating is based on company-level ESG Risk Scores provided by Sustainalytics, which evaluates a company's exposure to financially material ESG risks and how effectively those risks are managed. Morningstar combines the ESG Risk Scores of a fund's underlying holdings to calculate a portfolio-level ESG Risk Score and then ranks the fund against its peers.
|
Globe Rating |
Relative ESG Risk Ranking |
|
5 Globes |
Lowest ESG risk relative to peers |
|
4 Globes |
Above-average ESG risk management |
|
3 Globes |
Average |
|
2 Globes |
Below average |
|
1 Globe |
Highest ESG risk relative to peers |
Source: Morningstar
It is important to note that the Globe Rating is a relative measure rather than an absolute assessment of sustainability. A higher rating indicates lower unmanaged ESG risk relative to peers but does not necessarily mean that a fund follows a specific sustainable investment strategy or excludes particular sectors or activities.
The ESG portfolios were compared against broad market equity and bond benchmarks that do not apply explicit ESG screening. The analysis shows that both ESG Classic and ESG Tracker achieved 3 globes across equities and bonds, compared with 2 globes for their respective broad-market benchmarks. Whilst the Morningstar Sustainability Rating is only one measure of ESG risk, the results suggest that the ESG portfolios exhibit lower unmanaged ESG risk relative to comparable broad market exposures. This is consistent with Timeline's ESG approach, which combines targeted exclusions and positive fund selection whilst maintaining broad diversification and broad market exposure.
Importantly, the objective is not to maximise sustainability ratings in isolation, but to improve the overall ESG characteristics of the portfolios while preserving the long-term risk and return characteristics expected from broad market investing.
Product involvement screens
The table below summarises where product involvement screens are applied through the underlying funds used across the Timeline ESG Classic and ESG Tracker portfolio ranges. The presence of a screen should not be interpreted as a guarantee of zero exposure in third-party product involvement datasets. A “Yes” indicates that a screen or reduction approach is present for that category, but it should not be interpreted as a guaranteed 100% exclusion of all exposure. In practice, these screens may involve full exclusions, partial exclusions, or exclusions based on defined revenue thresholds, issuer classifications or other fund-level criteria, depending on the methodology of each underlying fund.
|
Product / conduct category |
ESG Classic 100 |
ESG Classic 0 |
ESG Tracker 100 |
ESG Tracker 0 |
|
|
|
Controversial Weapons |
Yes |
Yes |
Yes |
Yes |
|
|
Nuclear Weapons |
Yes |
Yes |
Yes |
Yes |
|
|
Tobacco |
Yes |
Yes |
Yes |
Yes |
|
|
Civilian Firearms / Small Arms |
Yes |
Yes |
Yes |
Yes |
|
|
Thermal Coal |
Yes |
Yes |
Yes |
Yes |
|
|
Fossil-Fuel Expansion |
Yes |
Yes |
Yes |
Yes |
|
|
UNGC / Norms Violators |
Yes |
Yes |
Yes |
Yes |
|
|
Severe ESG Controversies |
Yes |
Yes |
Yes |
Yes |
|
|
Adult Entertainment |
Yes |
No |
Yes |
Yes |
|
|
Gambling |
Yes |
No |
Yes |
Yes |
|
|
Alcohol |
Yes |
No |
No |
No |
|
|
Palm Oil |
Yes |
No |
No |
No |
|
|
Pesticides |
Yes |
No |
No |
No |













Source: Morningstar Direct, product involvement exclusion/reduction screen indicators for the underlying funds used within the relevant Timeline ESG Classic and ESG Tracker portfolio ranges, extracted as at 04/06/2026. A “Yes” does not necessarily indicate a 100% exclusion; it may reflect a full exclusion, partial exclusion, or an exclusion/reduction approach subject to revenue thresholds, issuer classifications or other methodology-specific criteria within Morningstar’s dataset.
Product Involvements
This section shows portfolio-weighted product involvement, which measures the proportion of portfolio holdings that are exposed to selected business activities across the equity/bond glidepath. Each chart compares the screened Timeline portfolios against the unscreened broad market benchmark for a given asset mix.
Figure 1. Product involvement (%) for a 50/50 equity-bond blend vs. market benchmark. Screened portfolios show materially lower involvement across categories.
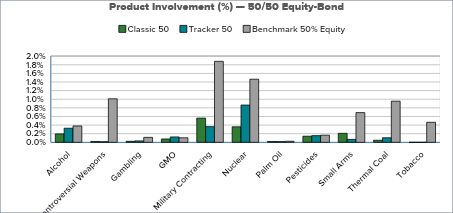
Source: Morningstar Direct, 2026
Figure 2. Product involvement (%) for the 100% equity mix vs. benchmark. Residual involvement is small and well below the benchmark across categories.
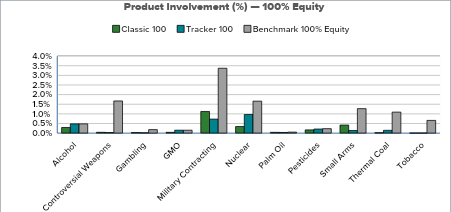
Source: Morningstar Direct, 2026
Figure 3. Product involvement (%) for the 100% bond mix vs. benchmark. Bond sleeves carry low product involvement overall.
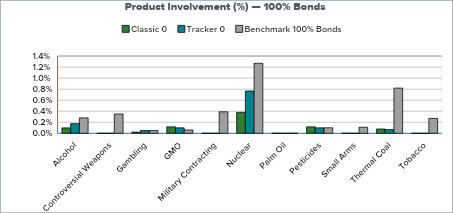
Source: Morningstar Direct and Timeline calculations. Product involvement represents the portfolio-weighted percentage of holdings with revenue exposure to the specified business activities, based on Morningstar Direct classifications. Data as at 30 April 2026. Market benchmark proxied by Vanguard FTSE All-World ETF for equities and Vanguard Global Bond Index Fund for bonds.
ESG Risk Scores
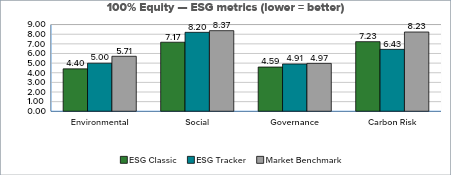
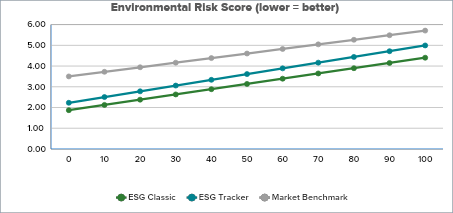
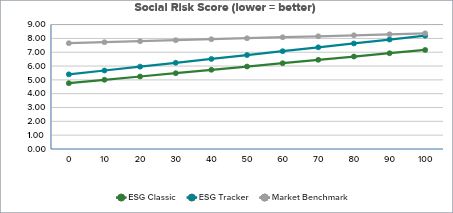
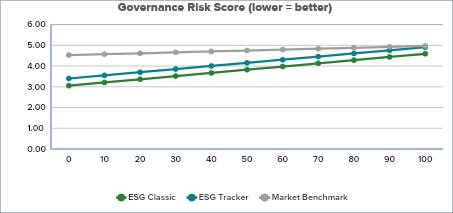
The ESG Risk Score analysis indicates that both the ESG Classic and ESG Tracker portfolios exhibit lower unmanaged ESG risk than the broad market benchmark across the Environmental, Social and Governance pillars. Environmental risk shows the greatest improvement relative to the benchmark, while Social and Governance risks are also modestly lower. The results suggest that the underlying managers' ESG integration, stewardship activities and screening frameworks contribute to a reduction in financially material ESG risks while preserving broad market exposure. This aligns with Timeline's view that ESG considerations can be incorporated as part of a long-term risk management framework rather than as a separate return objective.
Figure 4. 100% equity snapshot of E/S/G metrics (lower = better). The ESG portfolios beat the benchmark across all three pillars.
Source: Morningstar Direct, 2026
Figure 5. Environmental Risk Score across the glidepath (0%-100% equity). Environmental risk rises as equity weight increases, since bond sleeves score lower.
Source: Morningstar Direct, 2026
Figure 6. Social Risk Score by portfolio vs. benchmark (lower = better). Social risk is the largest pillar, with Timeline ESG portfolios modestly below the benchmark.
Source: Morningstar Direct, 2026
Figure 7. Governance Risk Score by portfolio vs. benchmark (lower = better).
Source: Morningstar Direct and Timeline calculations. ESG Risk Scores are asset-weighted unmanaged-risk scores derived from Sustainalytics data and reported via Morningstar Direct. Lower scores indicate lower unmanaged risk. Data as at 30 April 2026.
Carbon Emissions Analyses
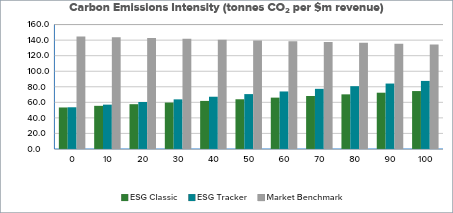
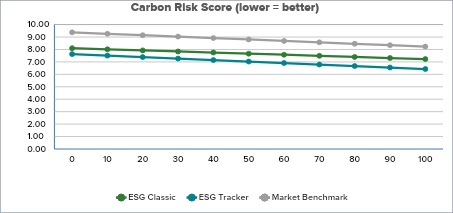
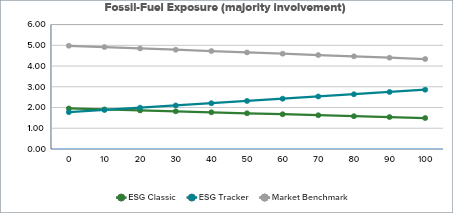
The carbon analysis demonstrates a meaningful reduction in emissions-related exposures across both ESG portfolio ranges relative to the market benchmark. Weighted average carbon intensity is substantially lower throughout the glidepath, while Carbon Risk Scores and the majority of fossil fuel exposure are also reduced. These results are broadly consistent with the carbon-conscious portfolio construction approaches employed by several of the underlying managers, which seek to lower exposure to fossil fuels and greenhouse gas emissions while maintaining diversified market exposure. From Timeline's perspective, this reflects a pragmatic approach to ESG investing that aims to reduce carbon-related risks without relying solely on blanket exclusions or concentrated portfolio positions.
Figure 8. Weighted average carbon intensity (Scope 1+2, tonnes CO₂ per $m revenue) by portfolio vs. benchmark. Timeline portfolios have markedly lower intensity.
Source: Morningstar Direct, 2026
Figure 9. Carbon Risk Score across all portfolios.
Source: Morningstar Direct, 2026
Figure 10. Fossil-fuel exposure on a majority-involvement basis vs. benchmark. ESG portfolios have low majority fossil-fuel exposure relative to the benchmark. The majority is defined as greater than 50% revenue generated by fossil fuel products.
Source: Morningstar Direct and Timeline calculations. Carbon emissions intensity is measured as weighted average carbon intensity (Scope 1 and 2 emissions, tonnes CO₂e per US$m revenue). Carbon Risk Scores are derived from Sustainalytics data and reported via Morningstar Direct. Data as at 30 April 2026.
Conclusion
The analysis shows that both the ESG Classic and ESG Tracker portfolios exhibit lower exposure to a range of ESG-related risks than their comparable broad-market benchmarks. Product involvement exposure is generally reduced across screened activities, ESG Risk Scores are lower across the Environmental, Social and Governance pillars, and carbon-related metrics indicate lower emissions intensity, lower carbon risk and reduced exposure to fossil fuel activities.
These outcomes have been achieved whilst maintaining broad diversification across global equity and fixed income markets. Overall, the findings are consistent with Timeline's approach of incorporating ESG considerations as part of a long-term risk management framework, using a combination of exclusions, positive selection and stewardship rather than relying on concentrated exposures or extensive exclusions.